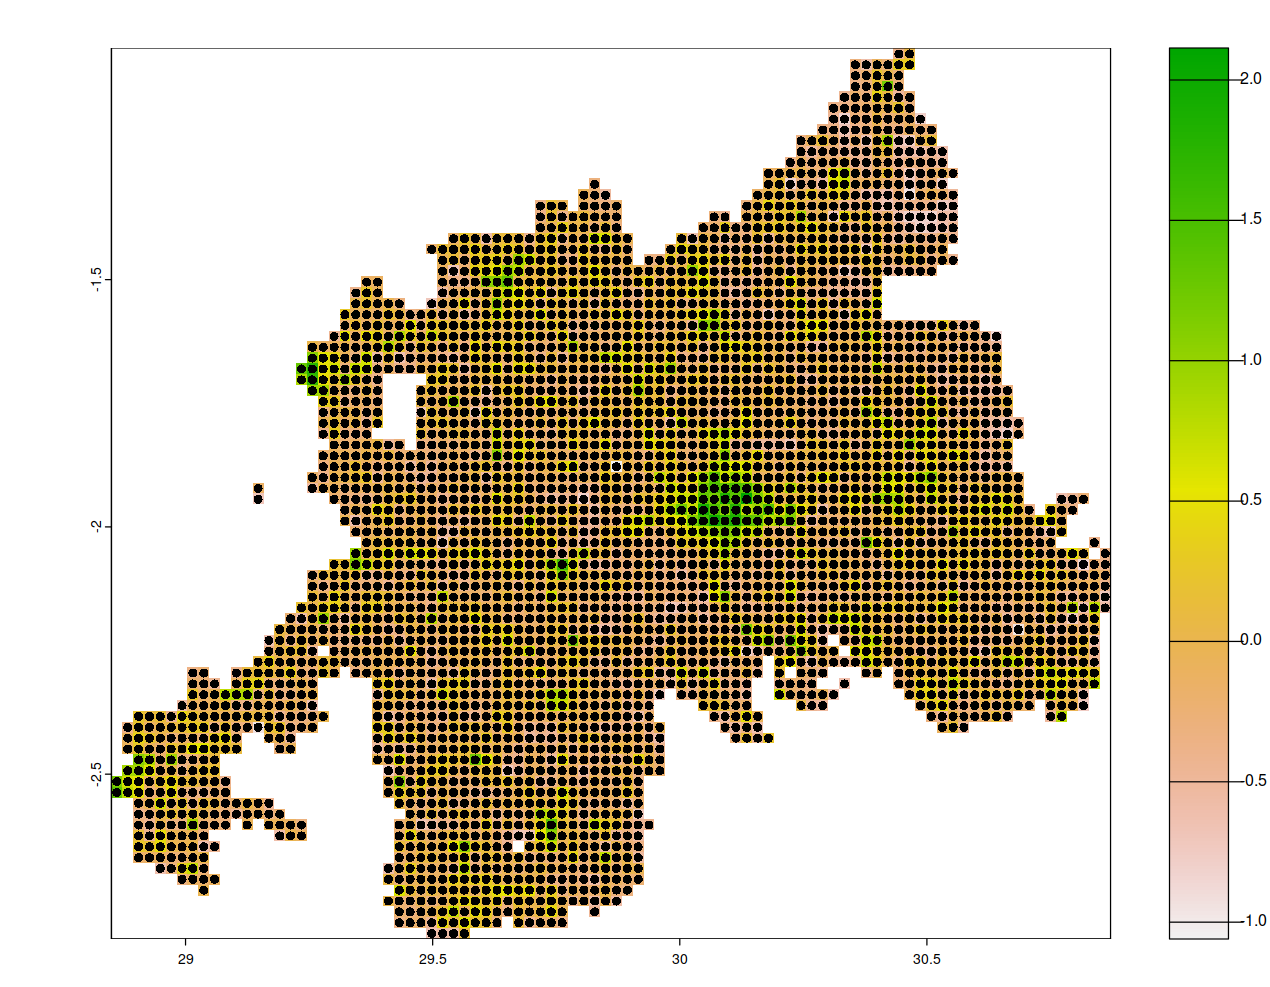
1

I would think there should be a simple solution to this, but I can't figure it out.

I have a csv file with the following data

wealth_data <- read.csv(text ="latitude,longitude,rwi,error
-2.8223442,29.498291,-0.656,0.297
-2.8223442,29.5202637,-0.544,0.296
-2.8223442,29.5422363,-0.586,0.294
-2.800398,29.498291,-0.474,0.297
-2.800398,29.5202637,0.439,0.289
-2.7784514,29.498291,-0.068,0.289
-2.7784514,29.5202637,0.151,0.312
-2.7784514,29.5422363,0.696,0.331", stringsAsFactors=FALSE) 

The entire dataset for rwanda can be downloaded here https://data.humdata.org/dataset/relative-wealth-index

And I can make it a sf dataframe

sf_wealth_data <- sf::st_as_sf(x = wealth_data,
                coords = c("longitude", "latitude"),
                crs = 4326)

now how do I make it into a terra raster object where the points of the sf are the center of the raster tiles, and the tiles take the value of just the one point at their center? The tiles without any points should have an NA value.

2
  • This would probably be easier if we were using the same data. You supplied three points along a single row in your question and provided an answer using a dataset much larger (in extent especially, and this might be crucial).
    – dimfalk
    Commented Apr 19 at 23:09
  • Thanks, I was a bit distracted and added the image of the data I was actually working with and not the example. I found the stars method did not work with just one row, so I added two more rows in the question, and with one missing (so that can be filled in with an NA). I updated the answer below. If you know how to do this in Terra, I would accept your answer over mine.
    – Cannon
    Commented Apr 21 at 12:06

3 Answers 3

4

There is indeed a rast.data.frame method in terra package, that allows to create a SpatRaster on the fly from a data frame. The issue with the data mentioned is that the cells are not regular, but we can overcame that issue by being less strict with the tolerance to irregular grids, that can be achieved with a lower digits value:

wealth_data <- read.csv("https://data.humdata.org/dataset/76f2a2ea-ba50-40f5-b79c-db95d668b843/resource/254e5daf-1ab0-47db-b40d-4abc2476e4ab/download/rwa_relative_wealth_index.csv")

# Need to re-arrange cols
wealth_data <- wealth_data[, c(2, 1, 3, 4)]

dplyr::glimpse(wealth_data)
#> Rows: 3,715
#> Columns: 4
#> $ longitude <dbl> 30.00366, 30.17944, 29.87183, 28.97095, 30.61890, 30.50903, …
#> $ latitude  <dbl> -1.658704, -1.351193, -1.351193, -2.515061, -2.185749, -1.24…
#> $ rwi       <dbl> -0.378, 0.385, -0.209, 0.457, -0.281, -0.452, -0.108, 0.198,…
#> $ error     <dbl> 0.393, 0.321, 0.297, 0.324, 0.290, 0.291, 0.292, 0.343, 0.33…

library(terra)
#> terra 1.7.71
terra::gdal()
#> [1] "3.7.2"

try(rast(wealth_data))
#> Error : [raster,matrix(xyz)] x cell sizes are not regular

# use lower digits

r_wealth_data <- rast(wealth_data, digits = 2, crs = "EPSG:4326")

r_wealth_data
#> class       : SpatRaster 
#> dimensions  : 82, 92, 2  (nrow, ncol, nlyr)
#> resolution  : 0.02197283, 0.02194634  (x, y)
#> extent      : 28.8501, 30.8716, -2.8333, -1.0337  (xmin, xmax, ymin, ymax)
#> coord. ref. : lon/lat WGS 84 (EPSG:4326) 
#> source(s)   : memory
#> names       :    rwi, error 
#> min values  : -1.060, 0.282 
#> max values  :  2.114, 0.522
plot(r_wealth_data)

Created on 2024-04-22 with reprex v2.1.0

1
  • This is the simpler solution, so I changed the accepted answer to this, but Dimfalk's answer also works
    – Cannon
    Commented Apr 23 at 7:58
3

Maybe I'm overthinking this (and there probably are better solutions using sf/terra) but at least I was able to make terra::rasterize() work. Would be interesting if the "manual" preparation can be simplified using some built-in functions.

Creating a raster from your points was further complicated (at least from my point of view) because you can't derive a uniform x/y resolution from your point spacings. It's not only different in x and y dimension, c.f. delta returned by stars::st_rasterize(), but also within each dimension - so I simply went with the mean resolution.

library(sf)
#> Linking to GEOS 3.11.2, GDAL 3.8.2, PROJ 9.3.1; sf_use_s2() is TRUE
library(terra)
#> terra 1.7.71

# est. x/y spacing and number of rows/cols from data
ydiff <- wealth_data$latitude |> diff() |> abs() |> round(7)
yres <- ydiff[ydiff != 0 & ydiff < 0.03]

xdiff <- wealth_data$longitude |> diff() |> abs() |> round(7)
xres <- xdiff[xdiff != 0 & xdiff < 0.03]

xyres.mean <- c(yres, xres) |> mean()

nr <- wealth_data$latitude |> unique() |> length()
nc <- wealth_data$longitude |> unique() |> length()

# extend original bbox of your points, since we're dealing with centroids, by res/2
v <- terra::vect(sf_wealth_data)
bbox <- (terra::ext(v) |> as.vector()) + c(-xyres.mean, xyres.mean, -xyres.mean, xyres.mean) / 2

# initialize destination raster
r <- terra::rast(nrows = nr, ncols = nc, crs = "epsg:4326", ext = bbox, res = xyres.mean)
r
#> class       : SpatRaster 
#> dimensions  : 3, 3, 1  (nrow, ncol, nlyr)
#> resolution  : 0.0219661, 0.0219661  (x, y)
#> extent      : 29.48731, 29.55321, -2.833327, -2.767429  (xmin, xmax, ymin, ymax)
#> coord. ref. : lon/lat WGS 84 (EPSG:4326)

# rasterize
result <- terra::rasterize(v, r, field = "rwi") 

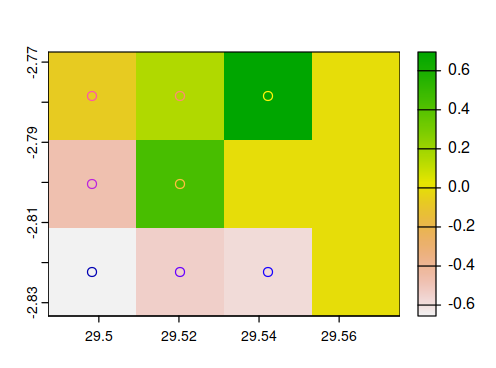
terra::plot(result)
terra::plot(v, add = TRUE)

And here is the plot when the method is applied to not just the reproducible example but the entire dataset of interest.

plot of rasterized data and vector data

Created on 2024-04-21 with reprex v2.1.0

0

I found this works using the stars package. It seems to center the tiles on the points and get the resolution between them right without any input from me.

star_wealth_data <- stars::st_rasterize(sf_wealth_data[1])
rast_wealth_data <- rast(star_wealth_data)
plot(rast_wealth_data$rwi)
plot(sf_wealth_data[1], add = T)

Plot of raster and vector data showing the tiles are centered

However, I would still be interested in an answer that did this with just Terra, which has a similar command rasterize() that I can't make work.

Your Answer

By clicking “Post Your Answer”, you agree to our terms of service and acknowledge you have read our privacy policy.

Not the answer you're looking for? Browse other questions tagged or ask your own question.