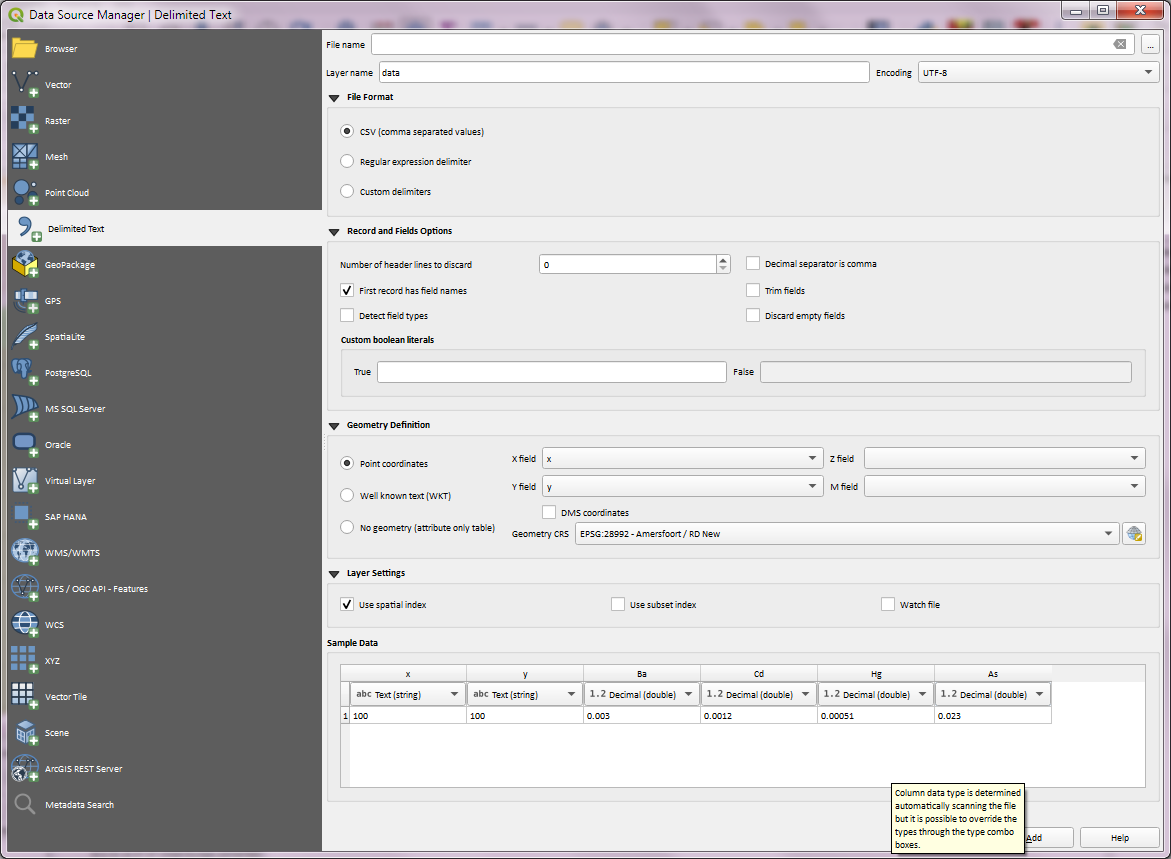
I have a KML file created in Google Earth that has points where we sampled 11 monitoring wells (my work uses Google Earth Pro and I'm trying to introduce QGIS). I have a CSV that has the contamination levels for constituents (arsenic, DDD, benzo, etc). Currently I can import both files to QGIS and join them on the monitoring well names no problem but...
Objective
- I want to use either kriging and IDW interpolation to create contour lines to see where the contour levels reach a certain level.
Problems
1 After I've joined the KML, exported to a shapefile (or just kept it as a KML, tried both) when I go to do an IDW interpolation, none of the contamination values are showing up in the drop down menu.
- My running theory is that the joined data is being interpreted as a string an not a double (I noticed after looking at the attribute table). Which leads me to problem 2.
- How do I make sure the joined values from the CSV are being interpreted as doubles?
I've made sure to format cells to make them "numbers" or "General" in Excel
I've done a work around by just creating a new column directly on to the KML file, specified it as a double and then tried to do the IDW interpolation. Which brings me to problem 3.
- Using the workaround method the IDW allows me to pick the parameter to interpolate but the exported raster doesn't show up and when I look at the upper and lower color value bounds, they are the same.
Side Note: I also tried to use the SmartMap plugin for kriging interpolation and it exported a table that looked correct but no heat map.


Distance coefficient Ptoo small.Grid(IDW with nearest neighbor)andHeatmapfrom the toolbox.