1

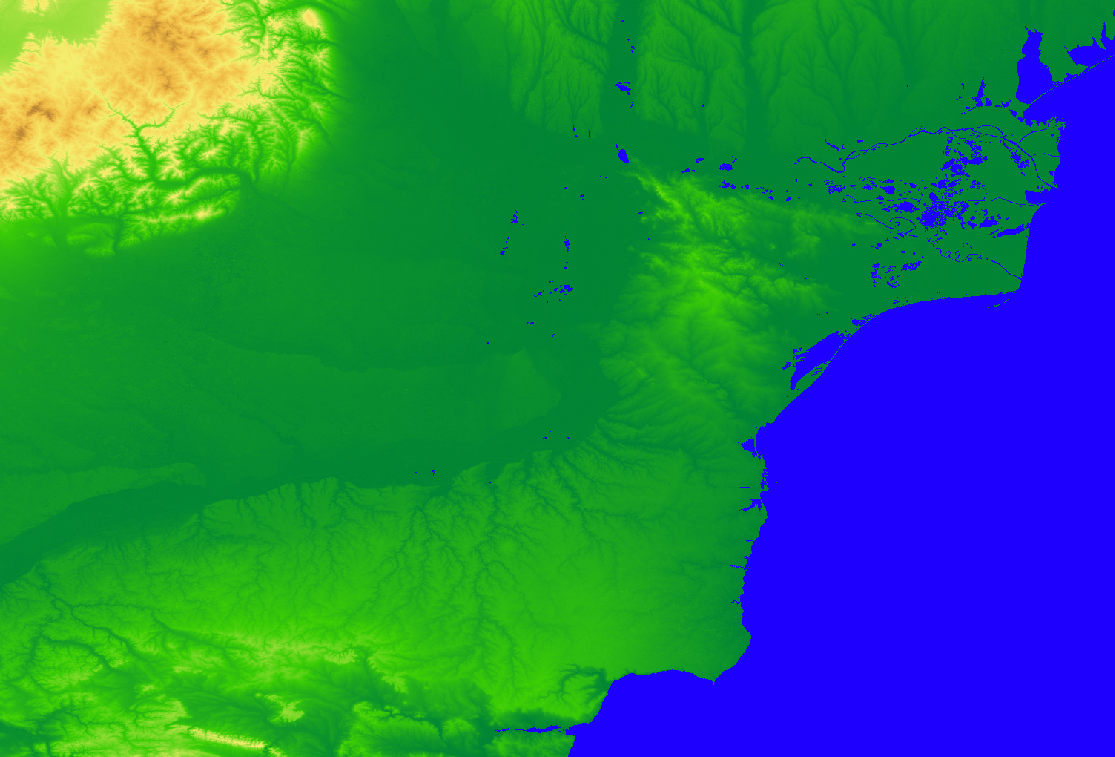
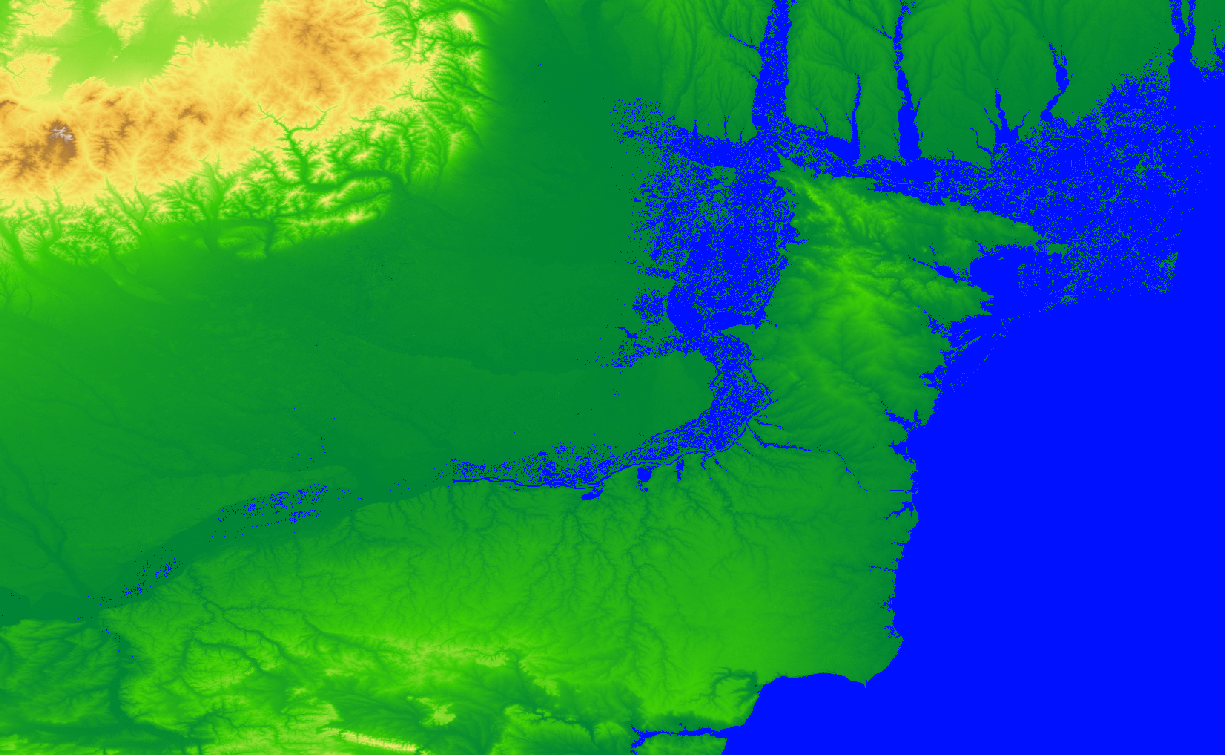
I saved two images from a Dem Tiff file in two different formats. There is no problem when saved as raw format. However, when you save it in rendered format, something like the second picture appears. Why do two such different results emerge from the same source?

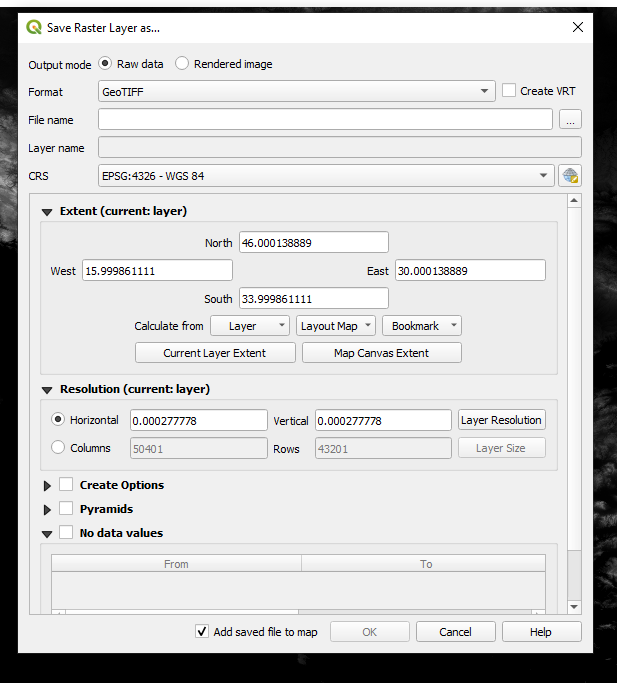
Export > Save As. I don't change any settings. This is the default. settings

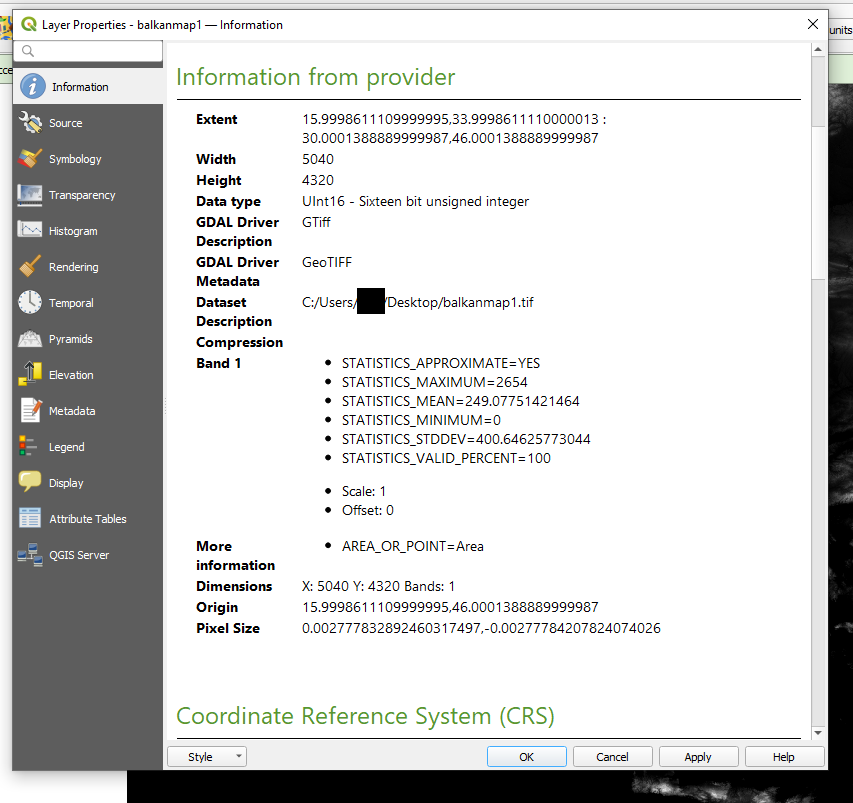
properties of the original map propnew

Firts image is result of ''saved as raw data''. Second image is result of ''saved as rendered image''.

raw image

rendered image

4
  • @user2856 Edited .I don't change any settings. This is the default.
    – William24
    Commented Jul 20 at 23:47
  • First option saves the Raw data (typically one band for a DEM), second saves the image, rendered based on the raster styling you have used.
    – Kasper
    Commented Jul 21 at 14:17
  • Does this help? gis.stackexchange.com/questions/480344/…
    – John
    Commented Jul 21 at 14:19
  • @John Unfortunately, I have no experience using gdal or pyhton. I don't know how to implement the solution he explained.
    – William24
    Commented Jul 21 at 18:33

1 Answer 1

2

What you expect as a result, beyond an explanation of the difference between RAW/Rendered is not really clear.

In short, if you save as Raw, what you save remains a DEM, if you save as Rendered it becomes a picture with no formal altitude information anymore.

When you have a DEM file, it is usually a singleband file where each pixel has one unique value: the pixel's altitude.

QGIS displays it with a color ramp applied to map each unique value, this color ramp can be changed in the Raster Style properties.

  • If you save your raster as Raw, it will save the the pixel altitude data, therefore the exact same file as the source file, unless you did some processing (smoothing, clipping, ...)

  • If you save it as Rendered, it will save it as a colored image with color values (RGB) according to the color ramp you are using. Once this is done, you have saved an RGB image and not a formal DEM anymore.


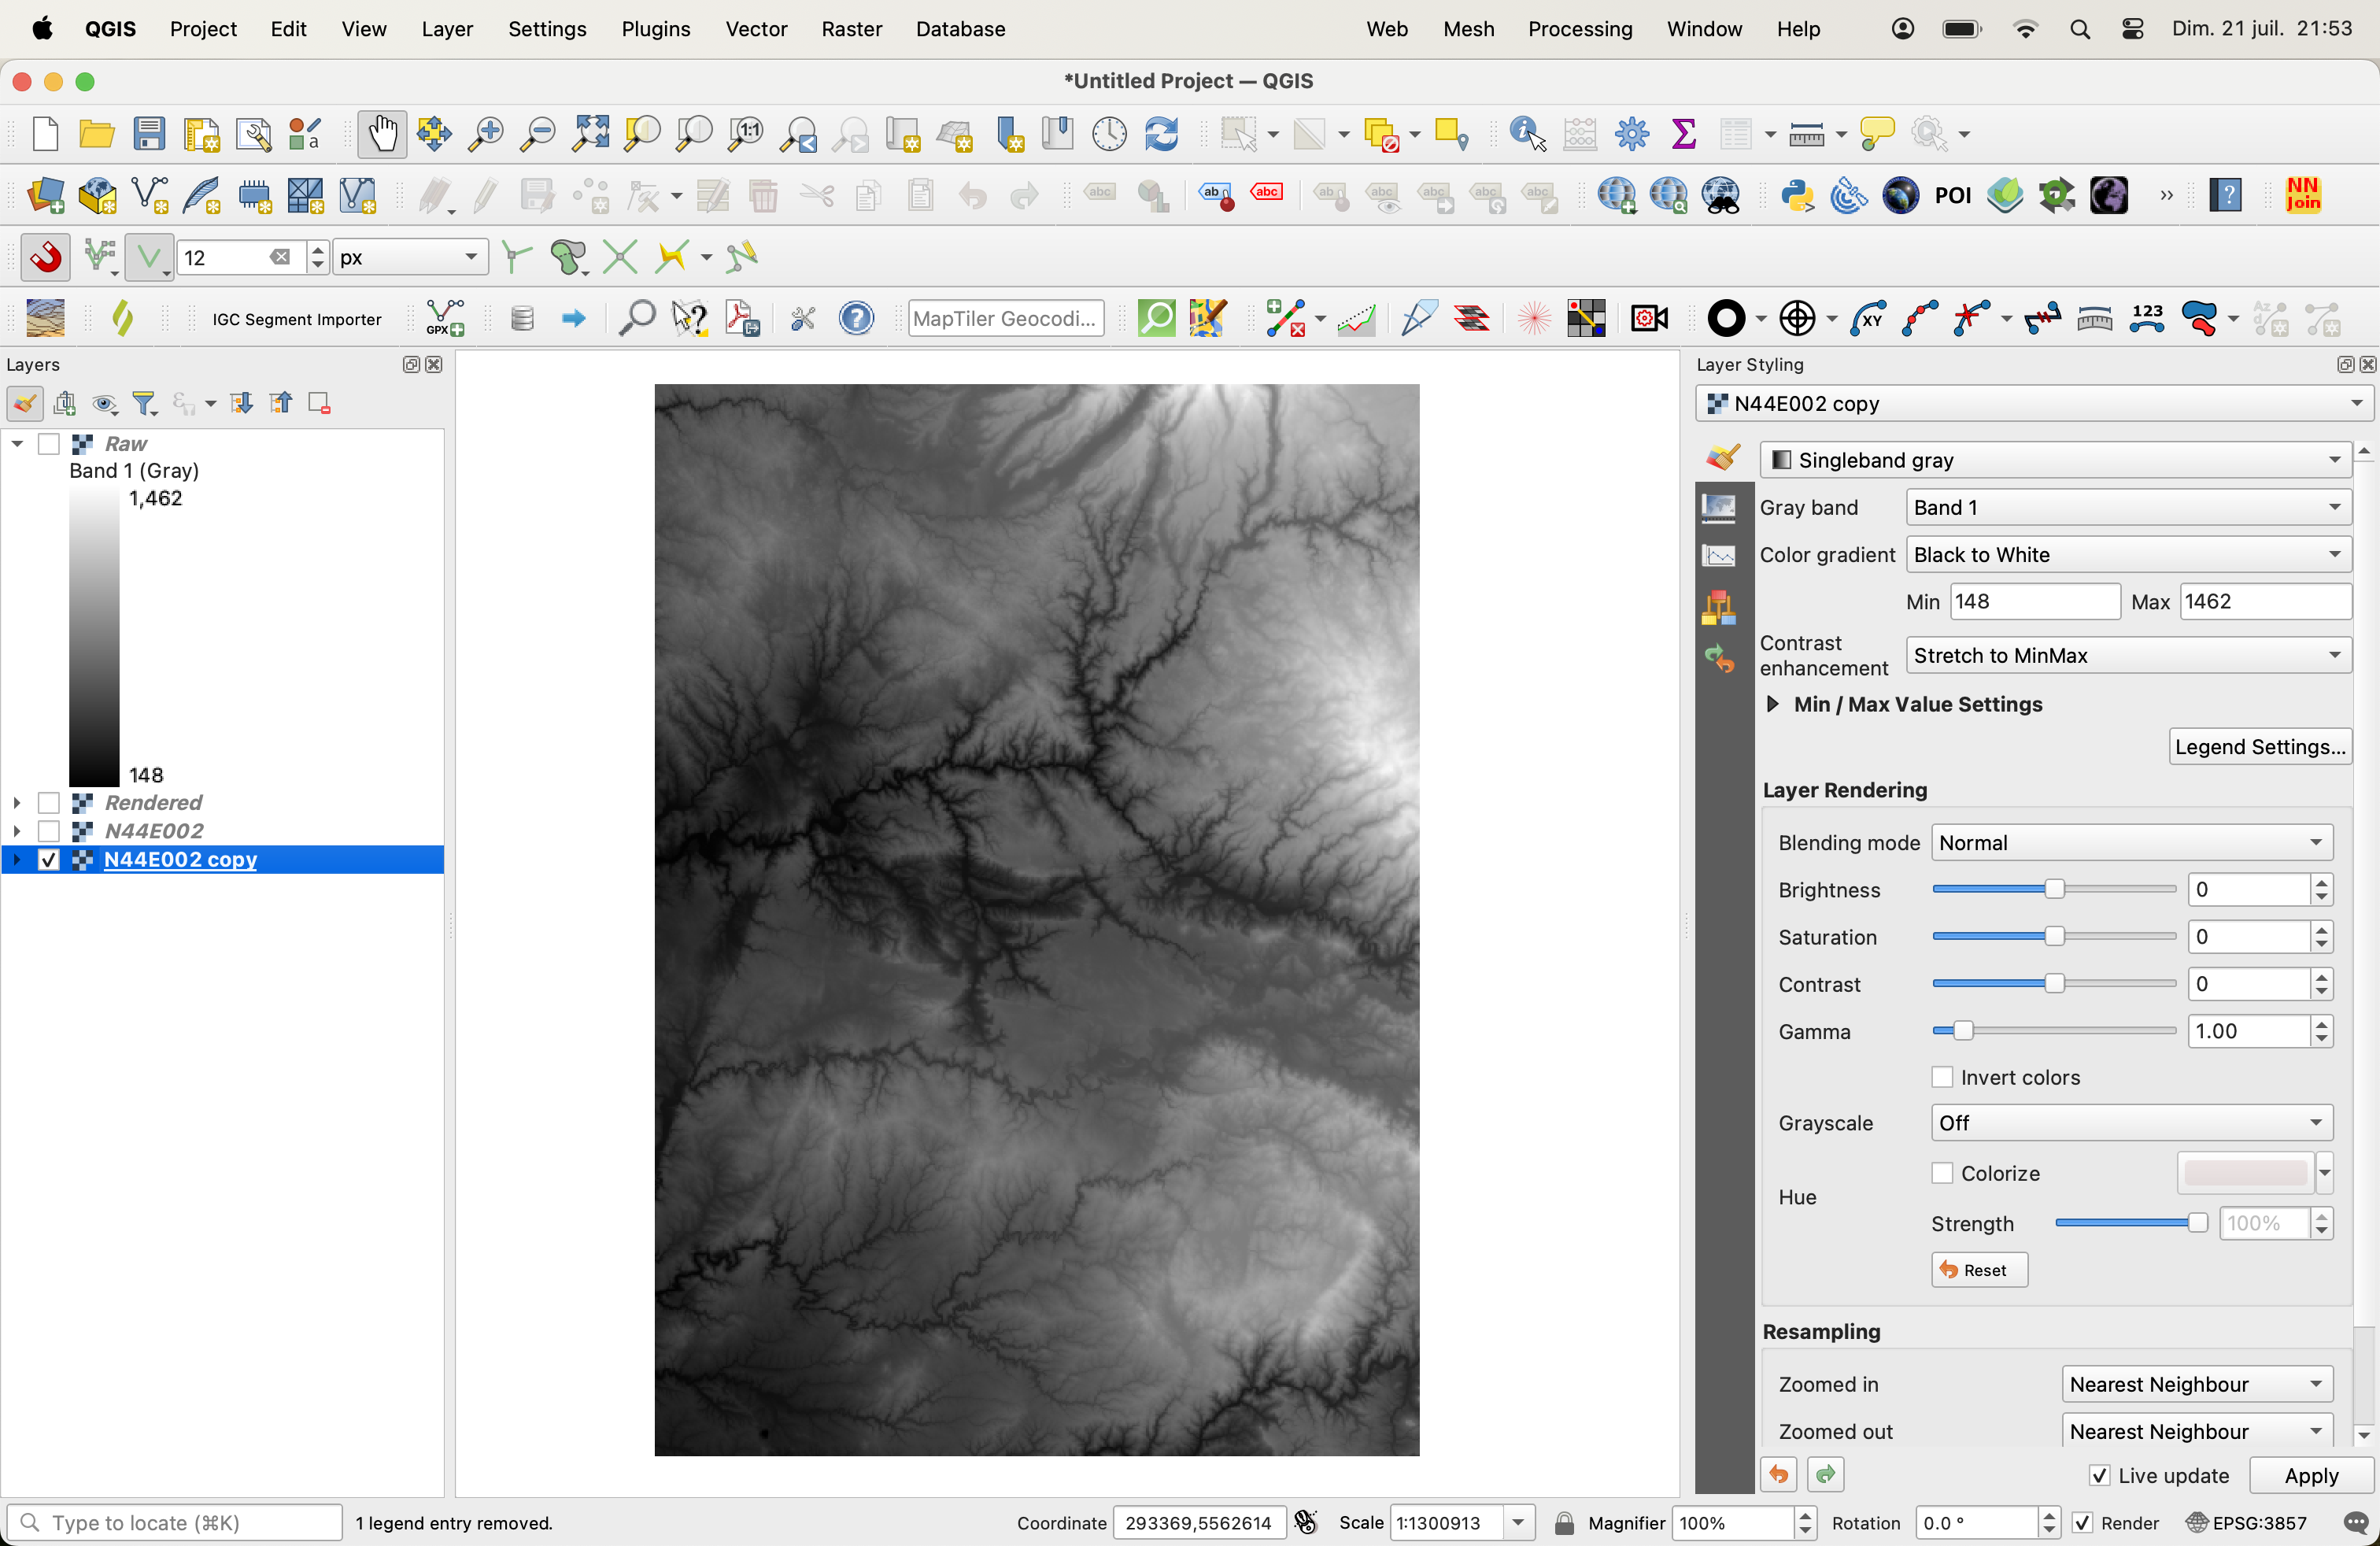
This is a DEM, with singleband values ranging from 148 to 1462 (meters), displayed with a singleband grey ramp:
enter image description here


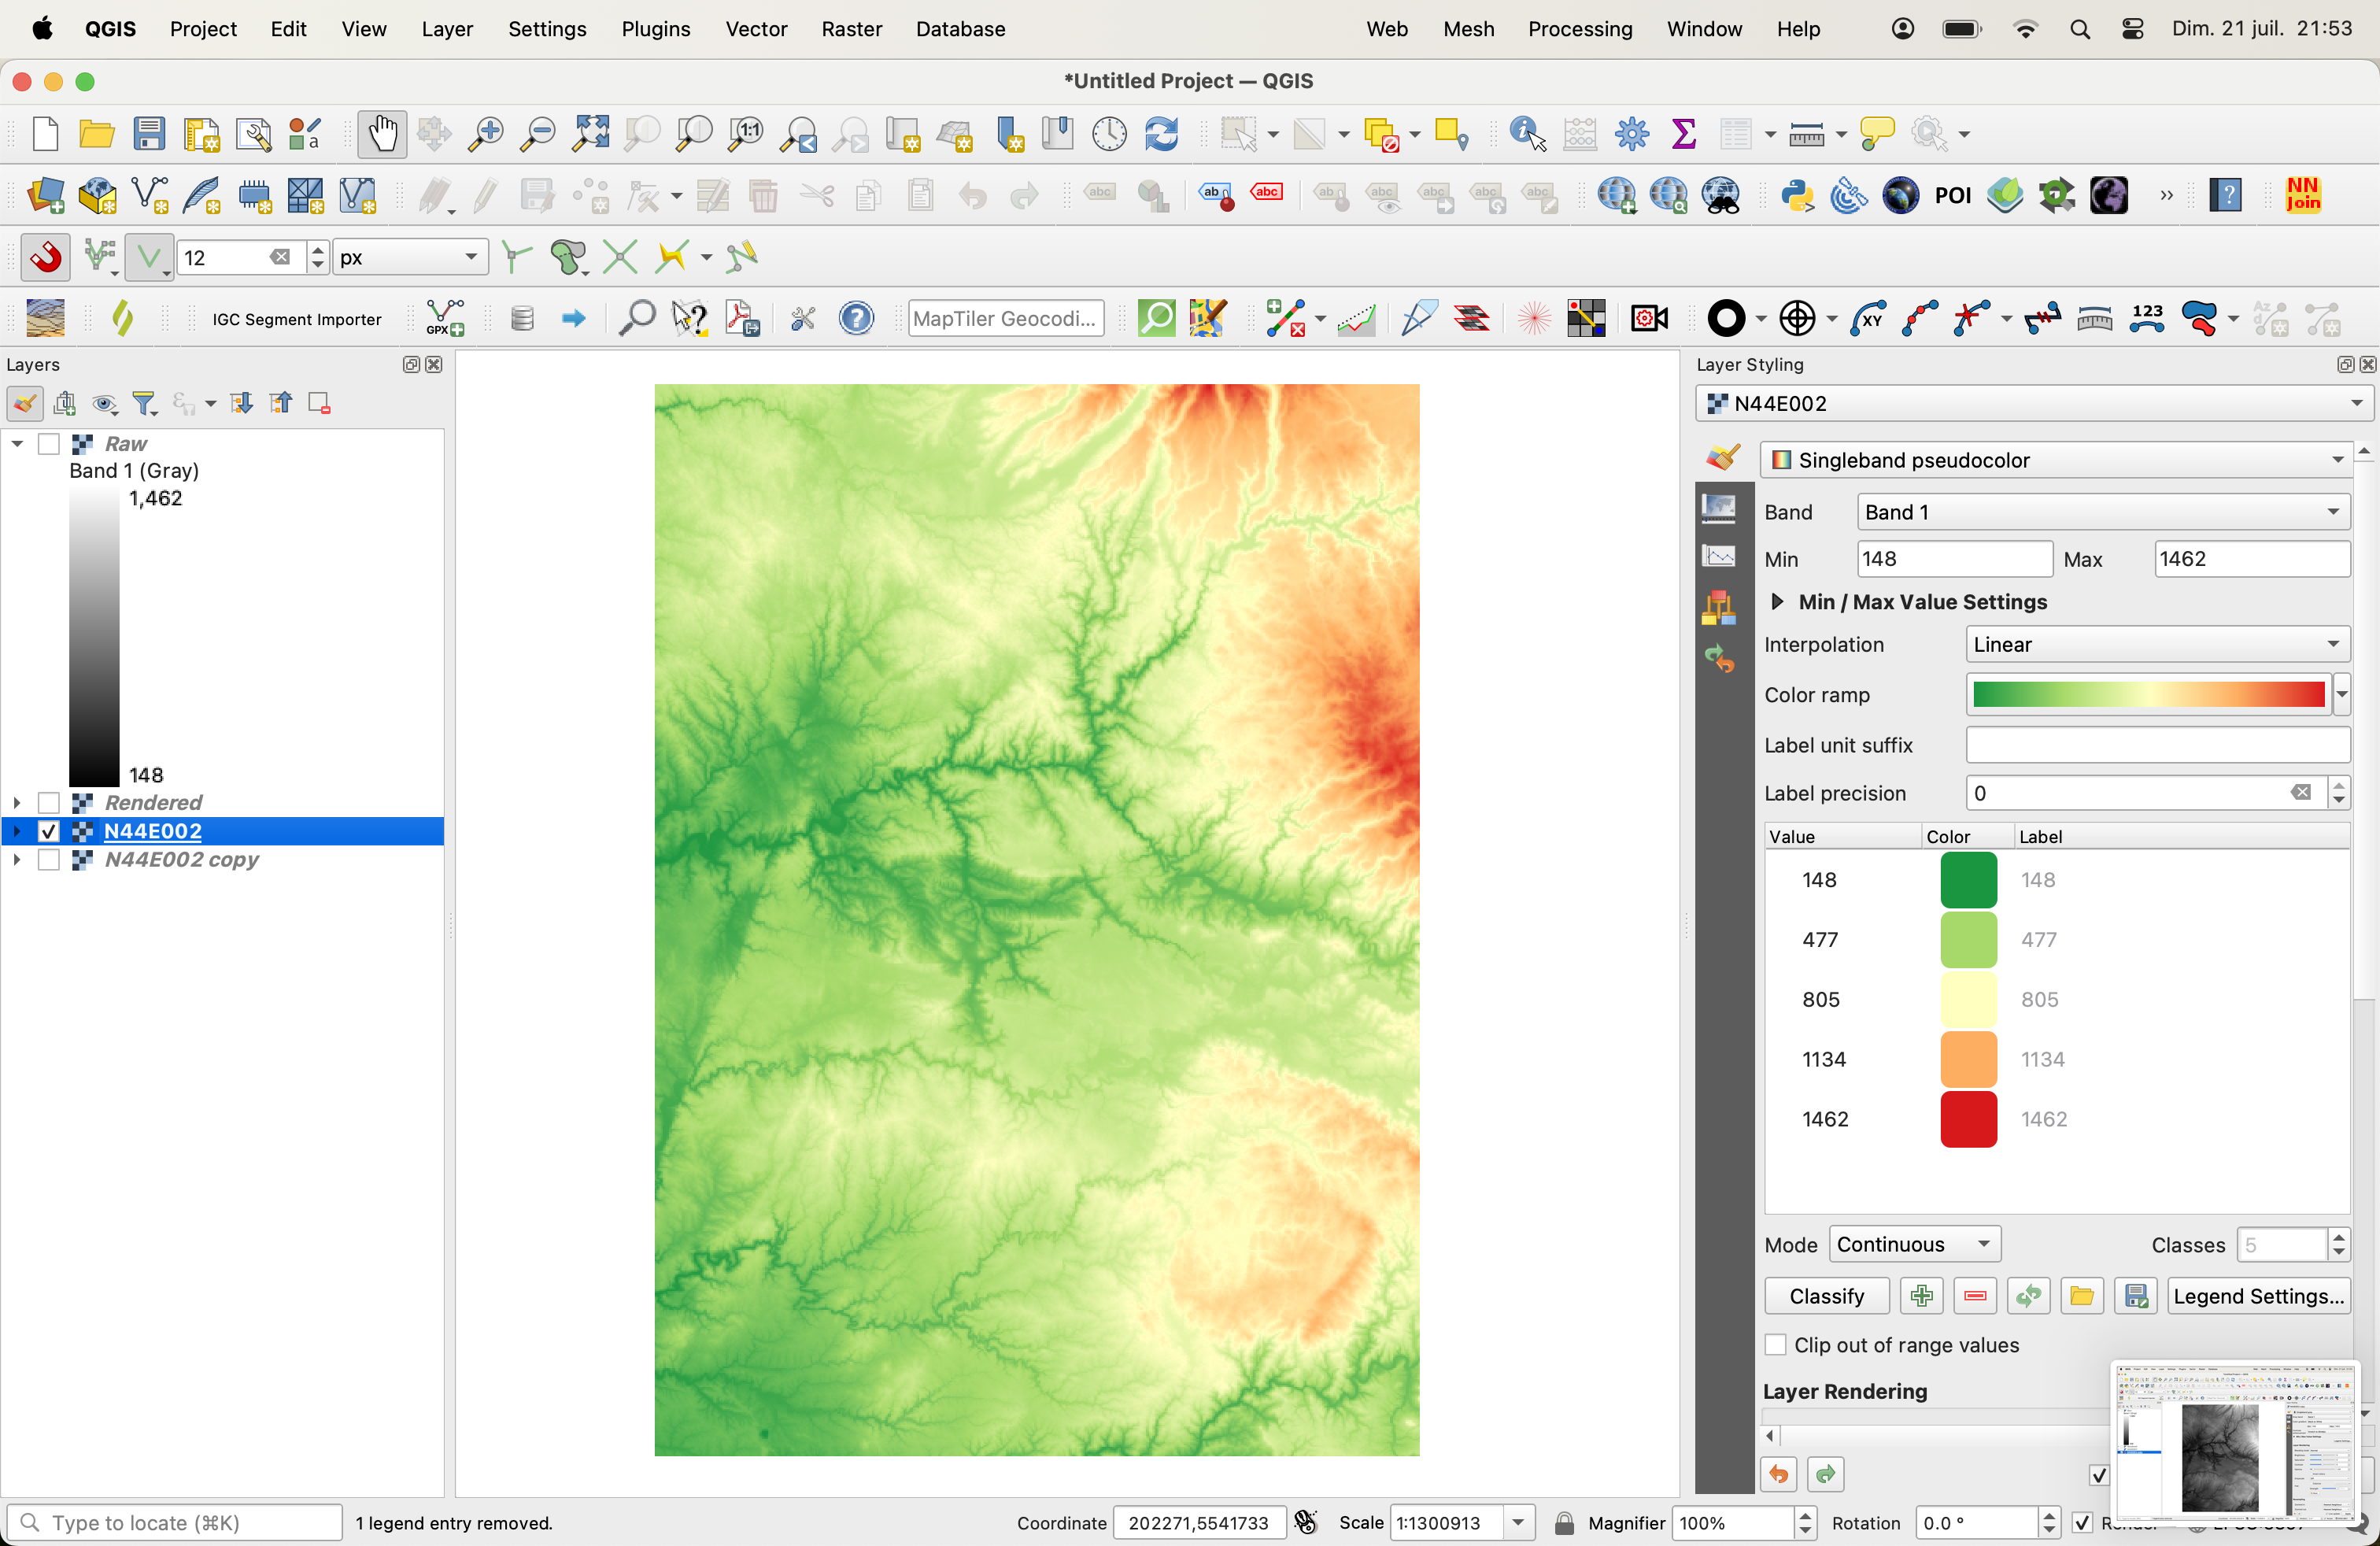
This is the very same DEM, with another color ramp:
enter image description here


If you save whichever of the above as Raw, it remains the very same file containing altitude data (148 to 1462 in this case), which QGIS will just display according to whichever color-ramp you choose:
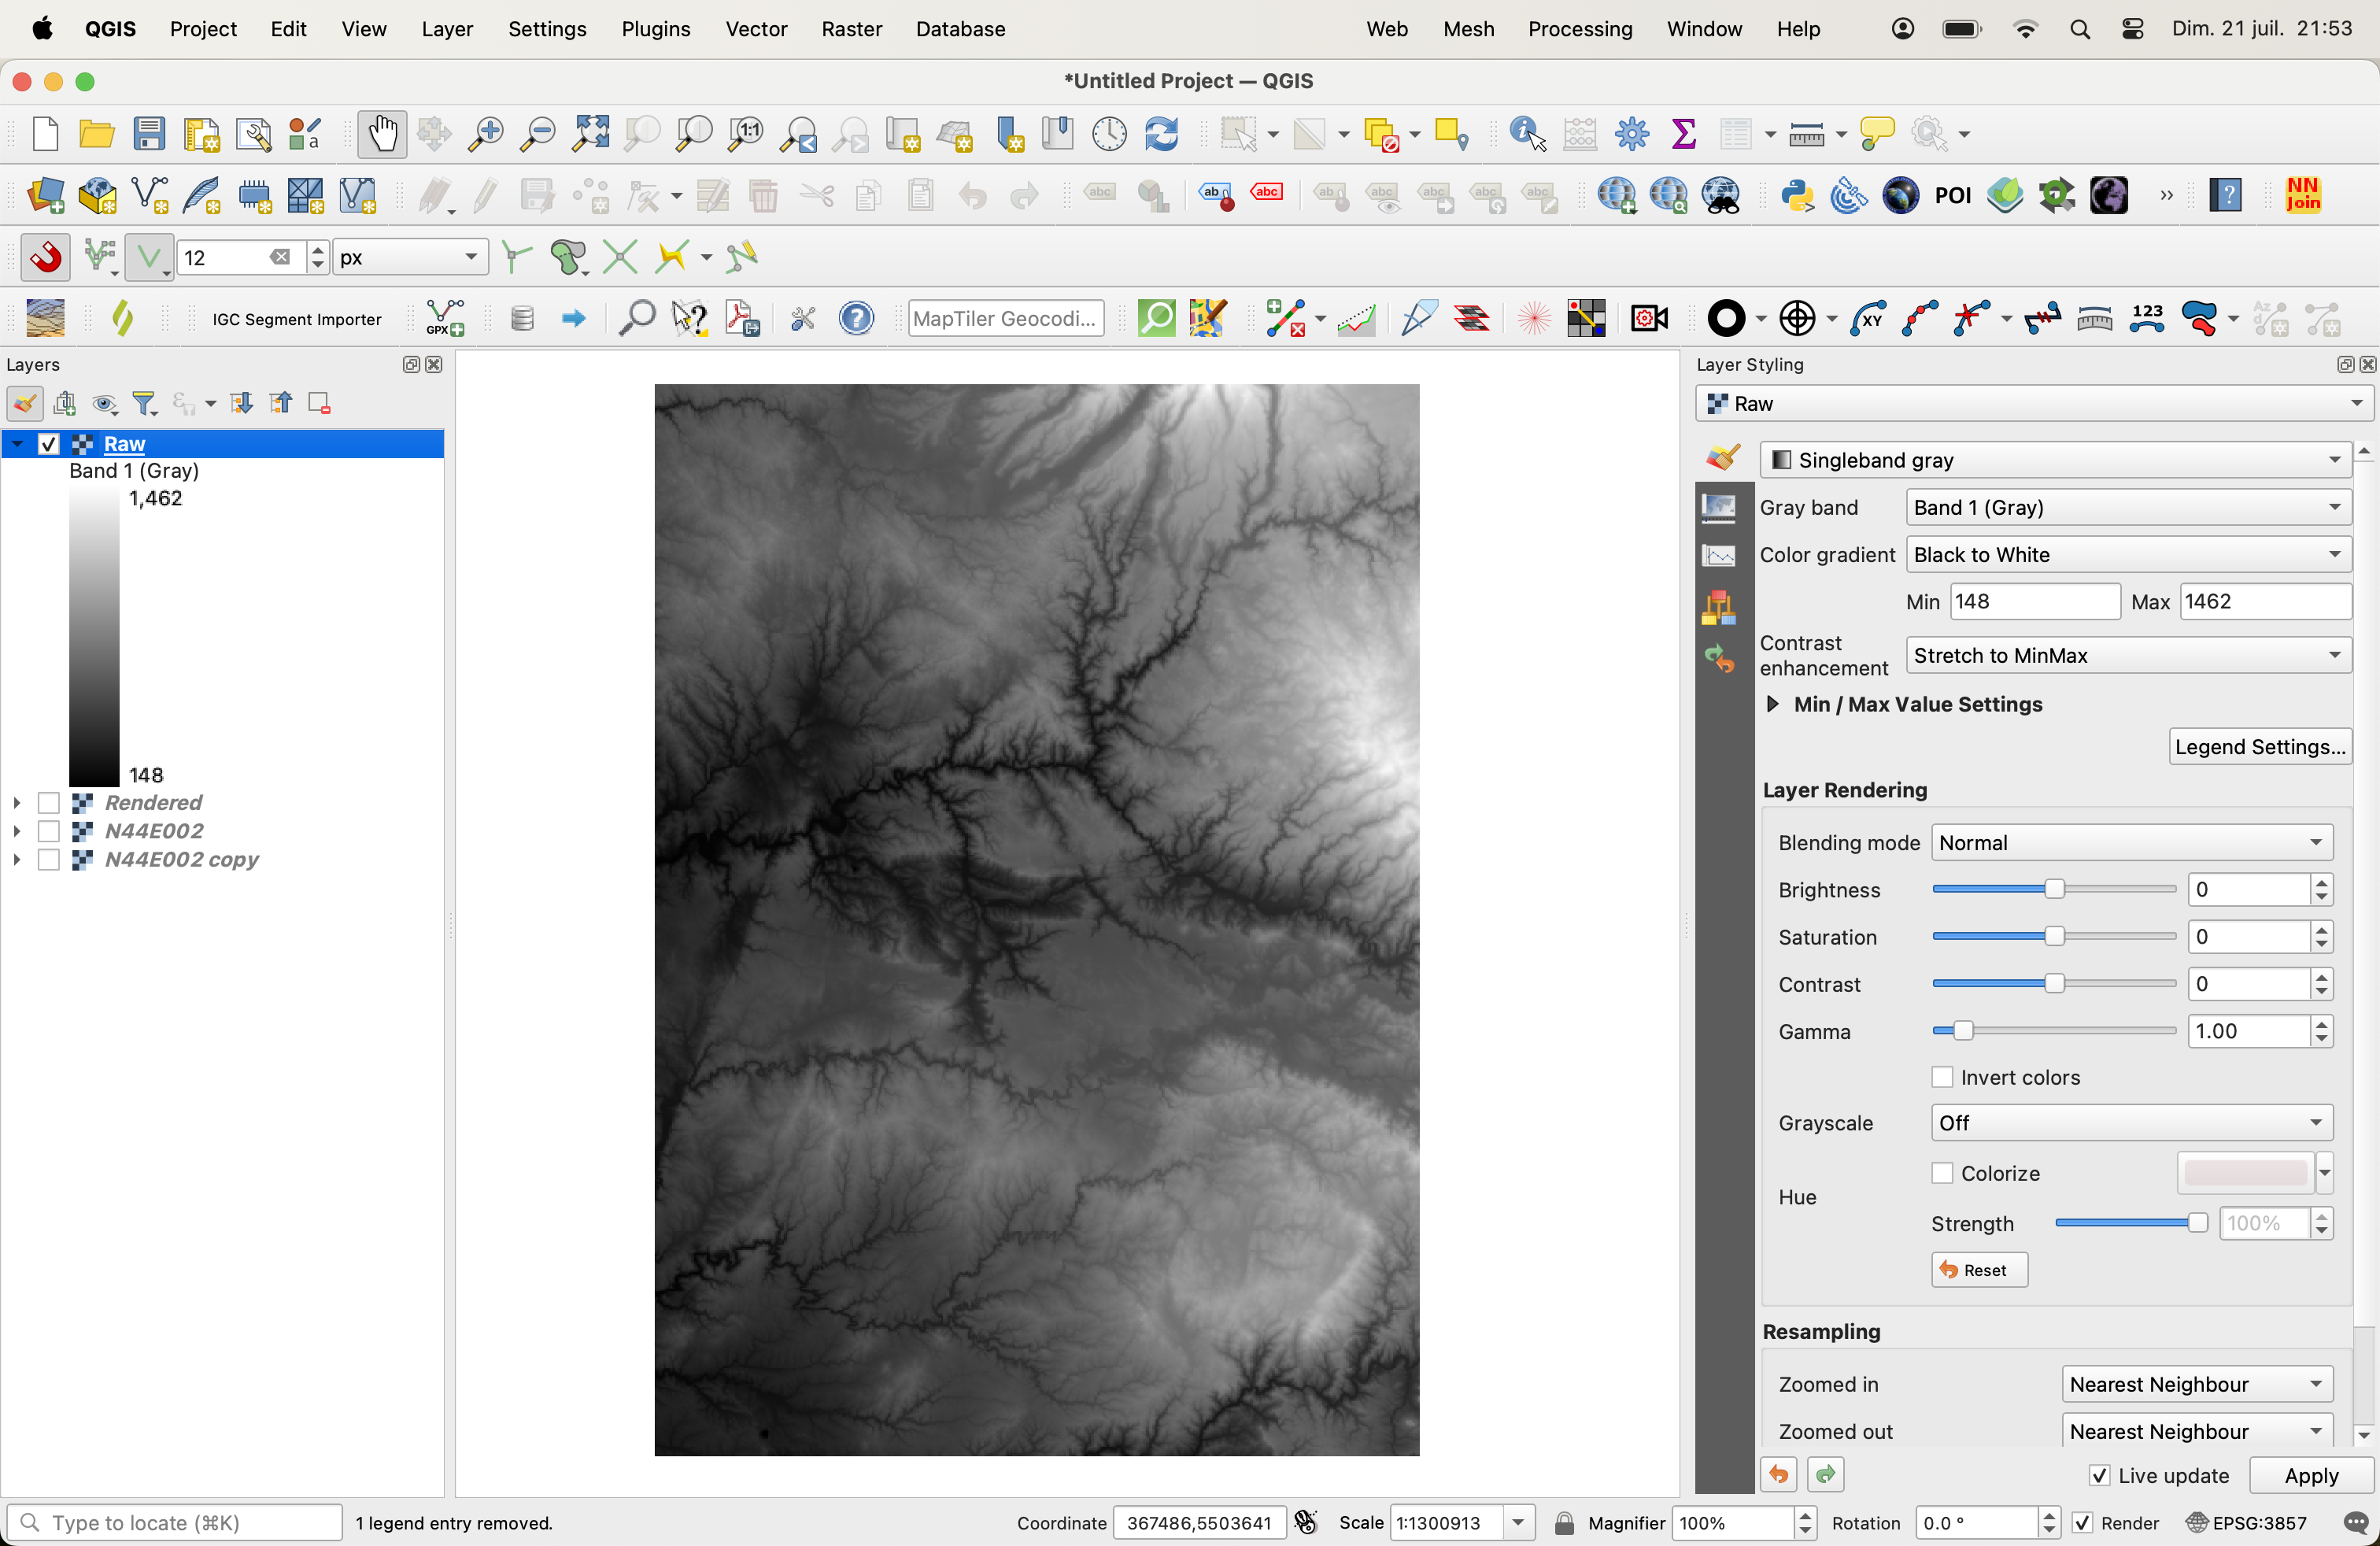
enter image description here


If you save the raster with a colored ramp as Rendered, it becomes an image, with 3 bands (RGB), each coded on 256 levels. As you can see in the right part of the picture, QGIS displays it as a multiband RGB image, rather than a singleband color ramp:
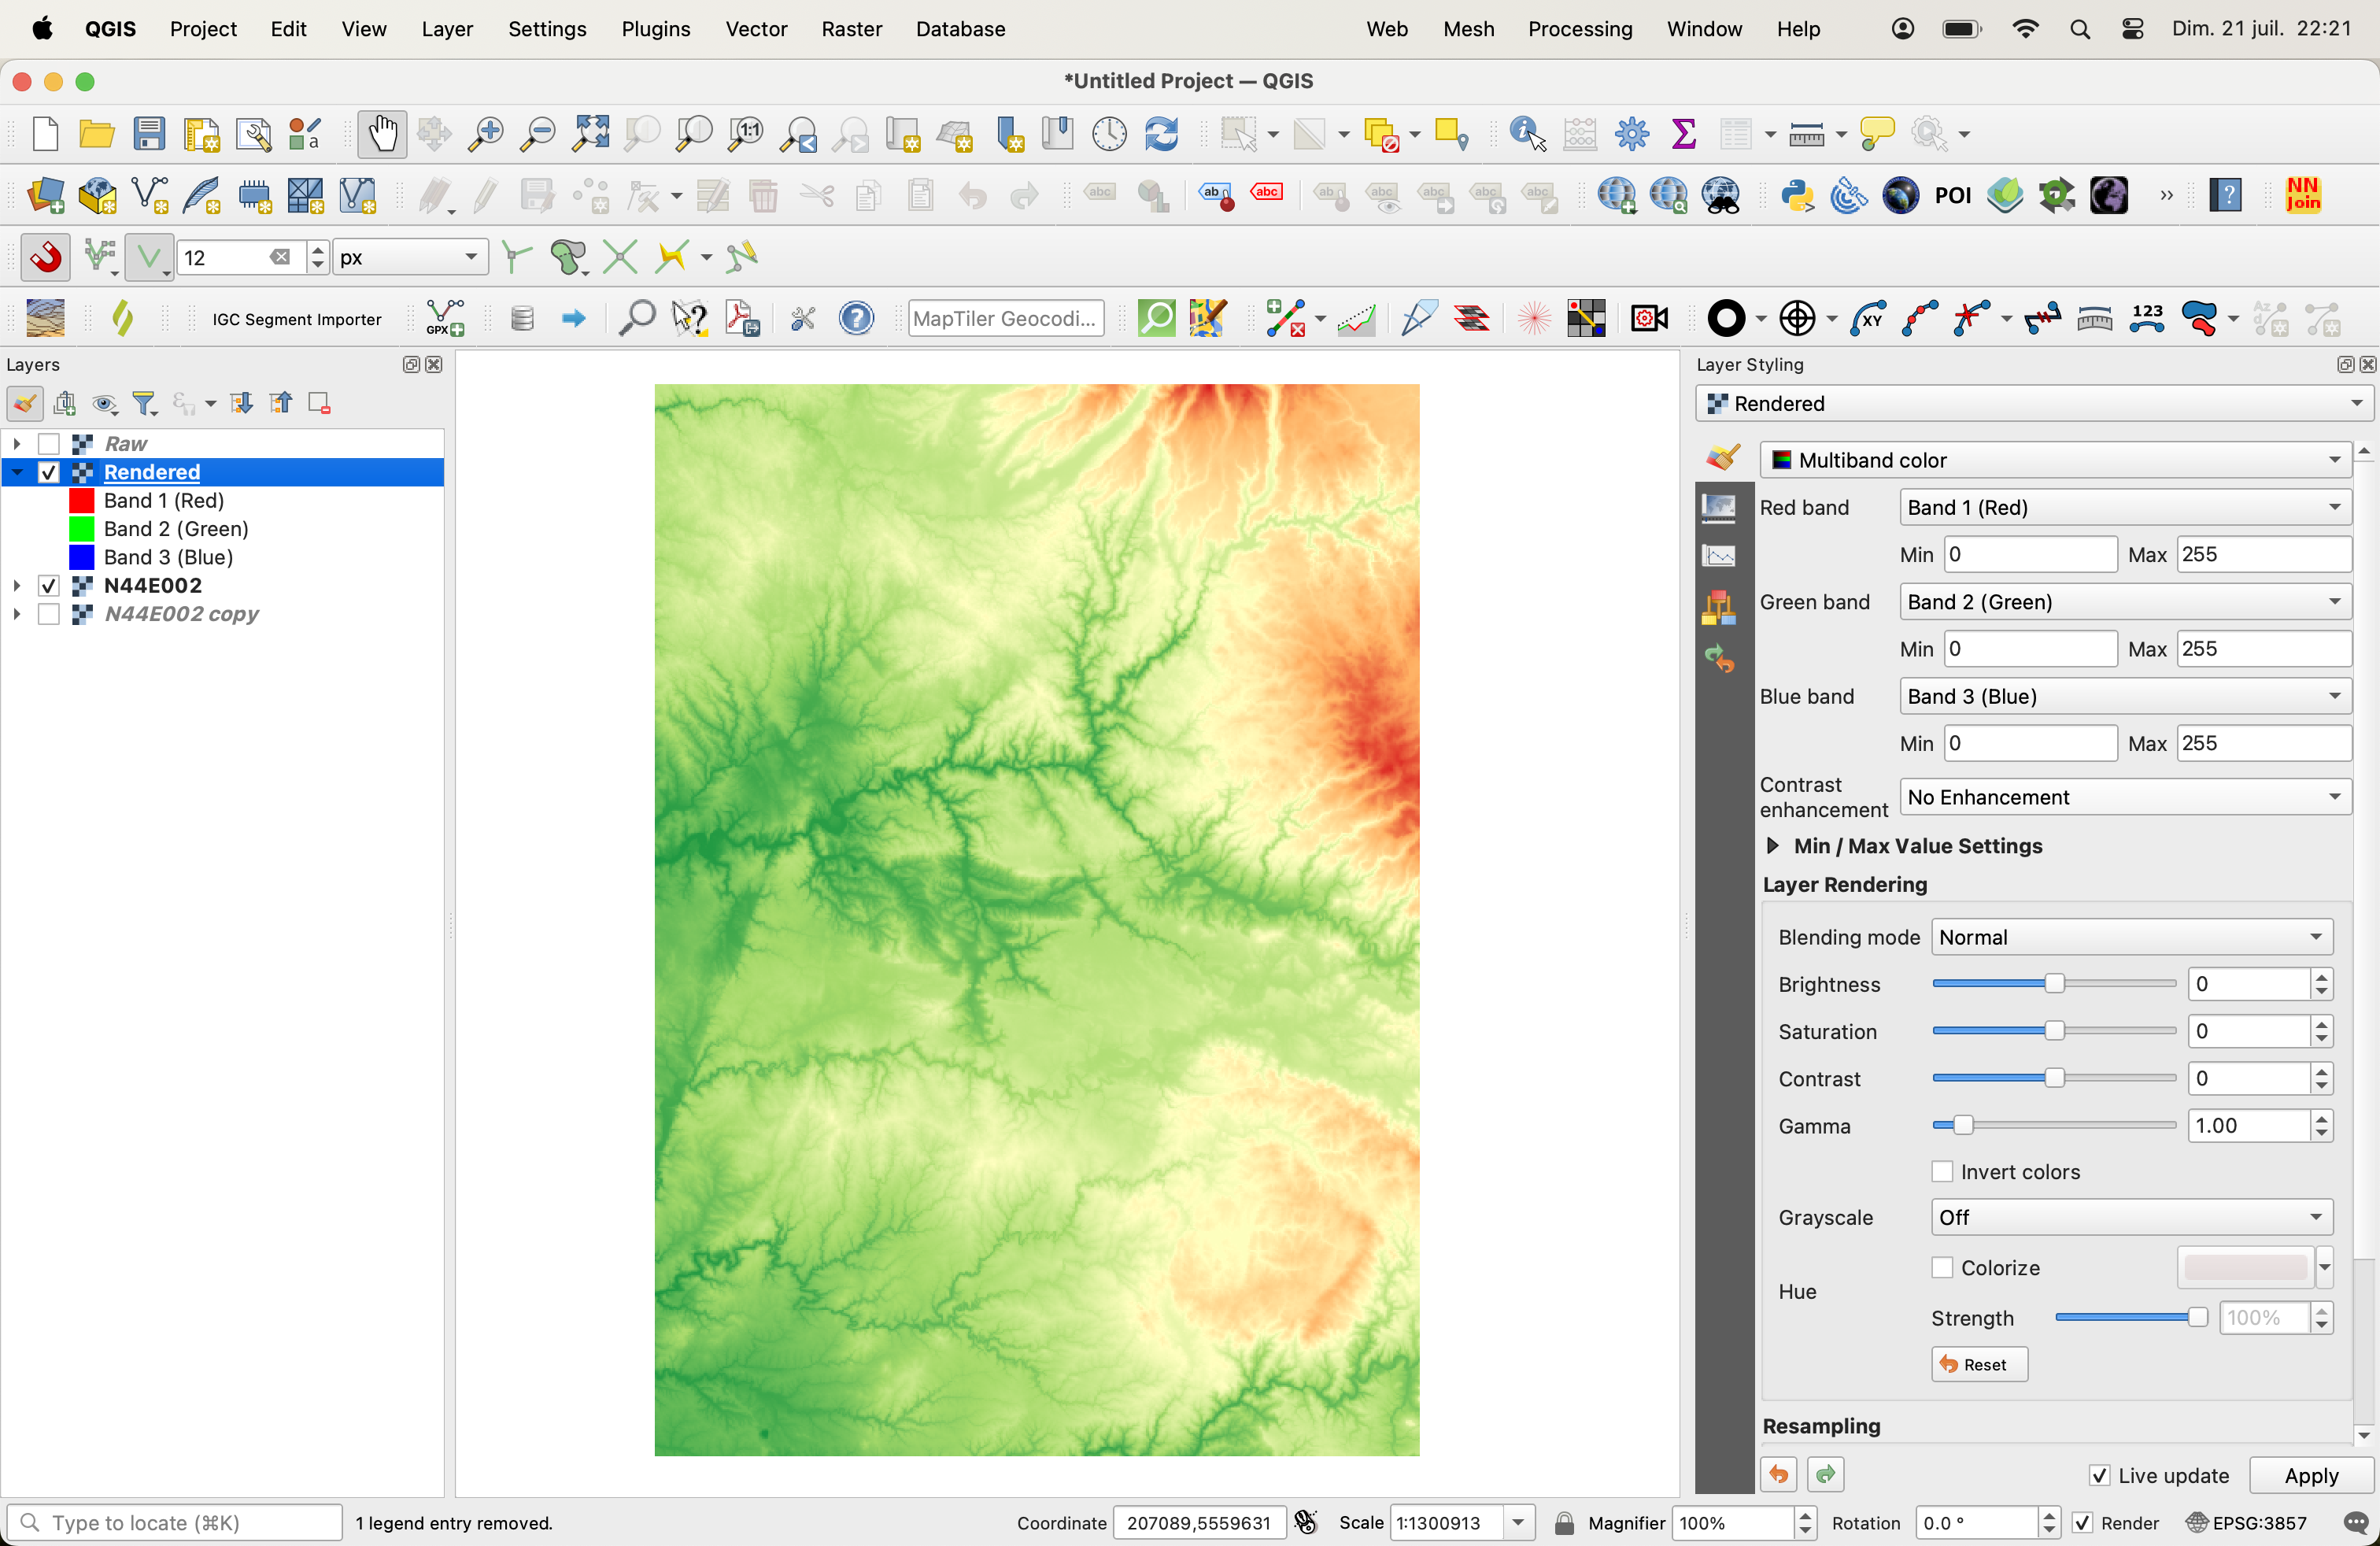
enter image description here

In the process of saving the file as 'rendered', you have lost the raw altitude information in the process.

By looking at the Style properties, you should be able to understand why each file (raw/singleband and rendered/multiband) shows up slightly differently. You might want to share the properties of your DEM to get a more detailed explanation.
7
  • I edited the question and add properties.
    – William24
    Commented Jul 21 at 22:55
  • You can look at the style (colour ramp properties) for both saved layers, it should explain why there is a difference slight difference. As you can see it happens at the end of the altitude range in flat ar as where slight numerical roundings in different encodings will be visible. What you are seeking remains unclear: do you want to save the image or the Dem, and what do you want to achieve overall that you currently can't?
    – Kasper
    Commented Jul 22 at 8:58
  • if you search the dobruja region of romania you will see that the second map is wrong on so many levels. I want to make a map that is geographically and physically accurate. Unfortunately, I need to do this as a rendered image because I need to transfer it to another program.
    – William24
    Commented Jul 22 at 17:51
  • OK, you want to export the map as a picture and want it to look like it is shown when displaying the DEM with a color ramp, you could edit the question make that more specific. A first test would be to open the "rendered" picture in another tool to checkit it displays in the same way QGIS opens it. Then share which settings you use to Style the DEM (show the style window, for the DEM and also the Rendered), and take time to understand how it works. One trick might be so set the Min value for the DEM color ramp to a slightly negative value to avoid artefacts
    – Kasper
    Commented Jul 23 at 7:58
  • I have tried it on the area that you mention (using SRTM DEM data) and I get the same for Rendred than what I get with RAw. Now your area is really tricky for beingreally flat. If your challenge is to have a clean coastline, which is difficult to extract from a raster in such flat areas, you can use a vector coastline layer to handle that part: use the DEM with everything in land color, and overlay the coastline/water side with blue.
    – Kasper
    Commented Jul 23 at 8:30

Your Answer

By clicking “Post Your Answer”, you agree to our terms of service and acknowledge you have read our privacy policy.

Not the answer you're looking for? Browse other questions tagged or ask your own question.