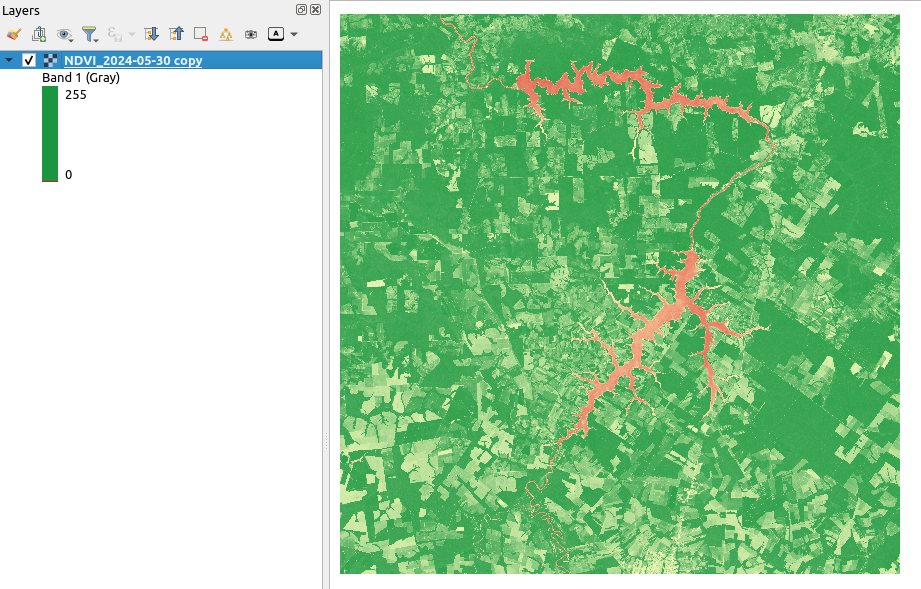
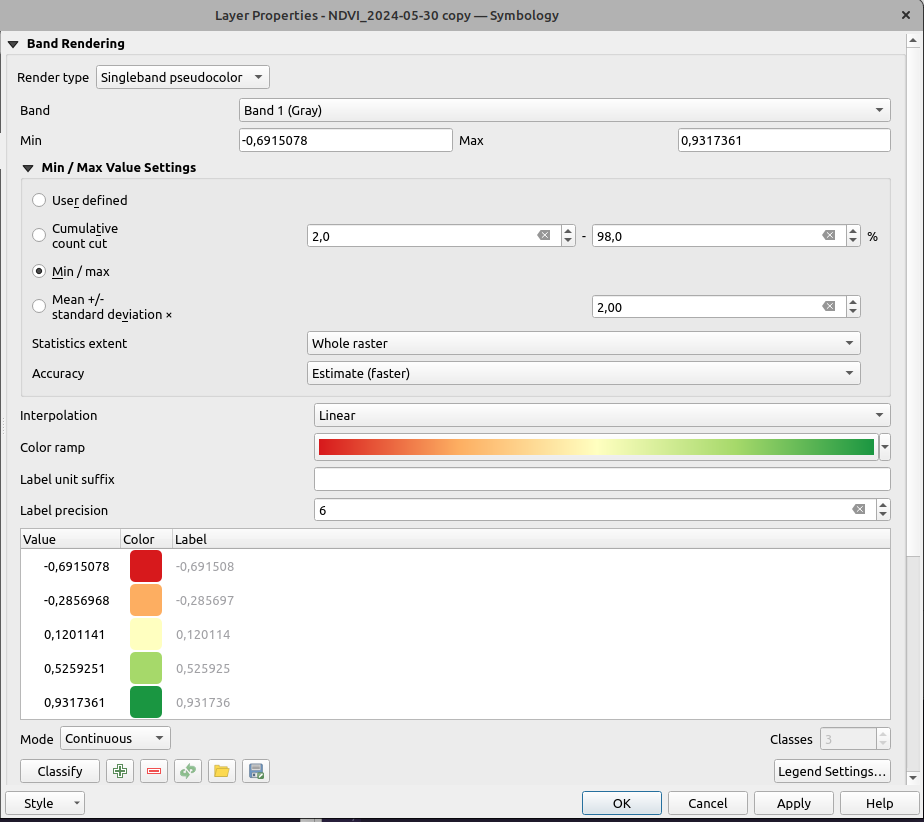
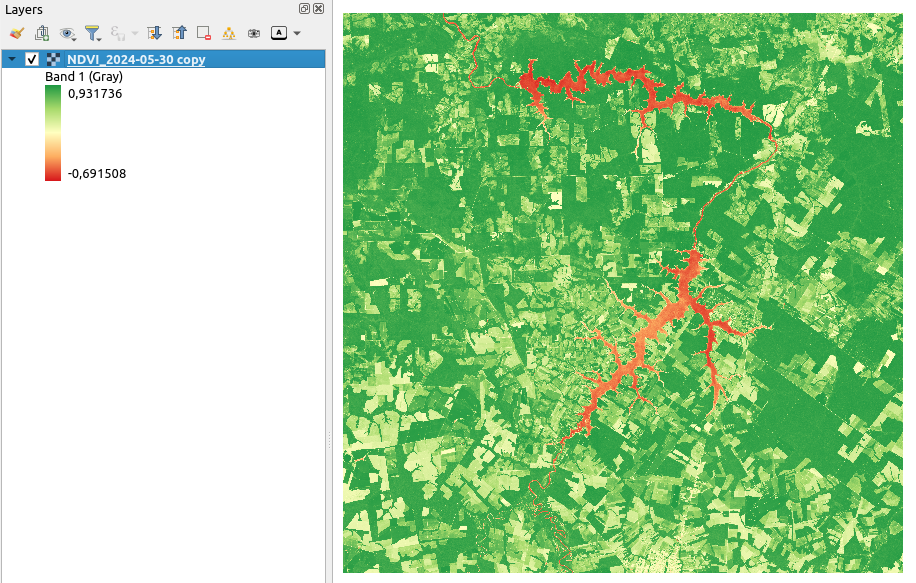
The code below aims to apply symbology based on NDVI values to the selected raster layer. However, after running the script it does not display correct information (image 1). I need to access layer properties and click OK or Apply to display correctly (image 2 and 3). In other words, the code works for its purpose but there is an error in displaying or loading the layer. I'm using QGIS 3.30, Linux Mint 21.3.
Band statistics for this layer:
- STATISTICS_APPROXIMATE=YES
- STATISTICS_MAXIMUM=0.93173605203629
- STATISTICS_MEAN=0.67241566769275
- STATISTICS_MINIMUM=-0.69150775671005
- STATISTICS_STDDEV=0.28242418703578
- STATISTICS_VALID_PERCENT=100

ndvi_layer = iface.activeLayer()

stats = ndvi_layer.dataProvider().bandStatistics(1, QgsRasterBandStats.All, ndvi_layer.extent(), 0)

min_value = stats.minimumValue
max_value = stats.maximumValue

style = QgsStyle().defaultStyle()
color_ramp = style.colorRamp('RdYlGn')

shader = QgsColorRampShader()
shader.setColorRampType(QgsColorRampShader.Interpolated)

min_color = color_ramp.color(0.0)
mid_color = color_ramp.color(0.5)
max_color = color_ramp.color(1.0)

items = [
    QgsColorRampShader.ColorRampItem(min_value, min_color, f'{min_value}'),
    QgsColorRampShader.ColorRampItem((min_value + max_value) / 2, mid_color, f'{(min_value + max_value) / 2}'),
    QgsColorRampShader.ColorRampItem(max_value, max_color, f'{max_value}')
]
shader.setColorRampItemList(items)

raster_shader = QgsRasterShader()
raster_shader.setRasterShaderFunction(shader)

renderer = QgsSingleBandPseudoColorRenderer(ndvi_layer.dataProvider(), 1, raster_shader)
ndvi_layer.setRenderer(renderer)
ndvi_layer.triggerRepaint()
iface.mapCanvas().refreshAllLayers()


