Possible Duplicate:
How to interpret GRASS v.kernel results?
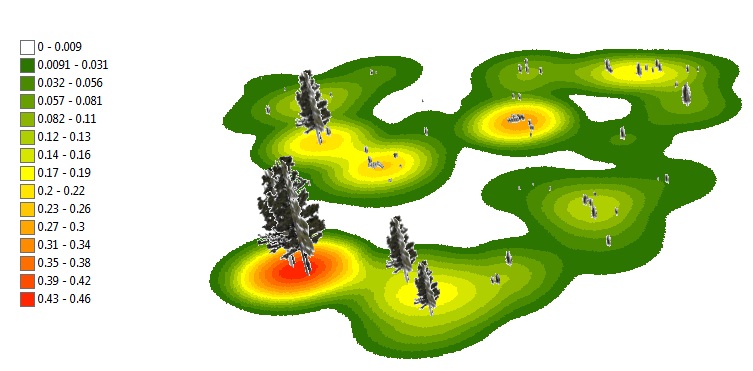
The attached image shows trees in a study area based on their actual height in the field. The trees are overlaying a raster that was produced in ArcGIS using the Kernel Density tool. A population field was used for the kernel density estimate which included the tree heights in meters. The following descriptive statistics are for the displayed trees in the image:
- n = 117
- Min height = 0.2 m
- Max height = 8.68 m
- Mean height = 0.76 m
How should I interpret the results of the kernel density estimate as displayed in the legend? You can see the largest KDE value is approximately half the average tree height. What am I missing here?

