19

I get some data with number of specimens with a request to interpolate it using kriging method.
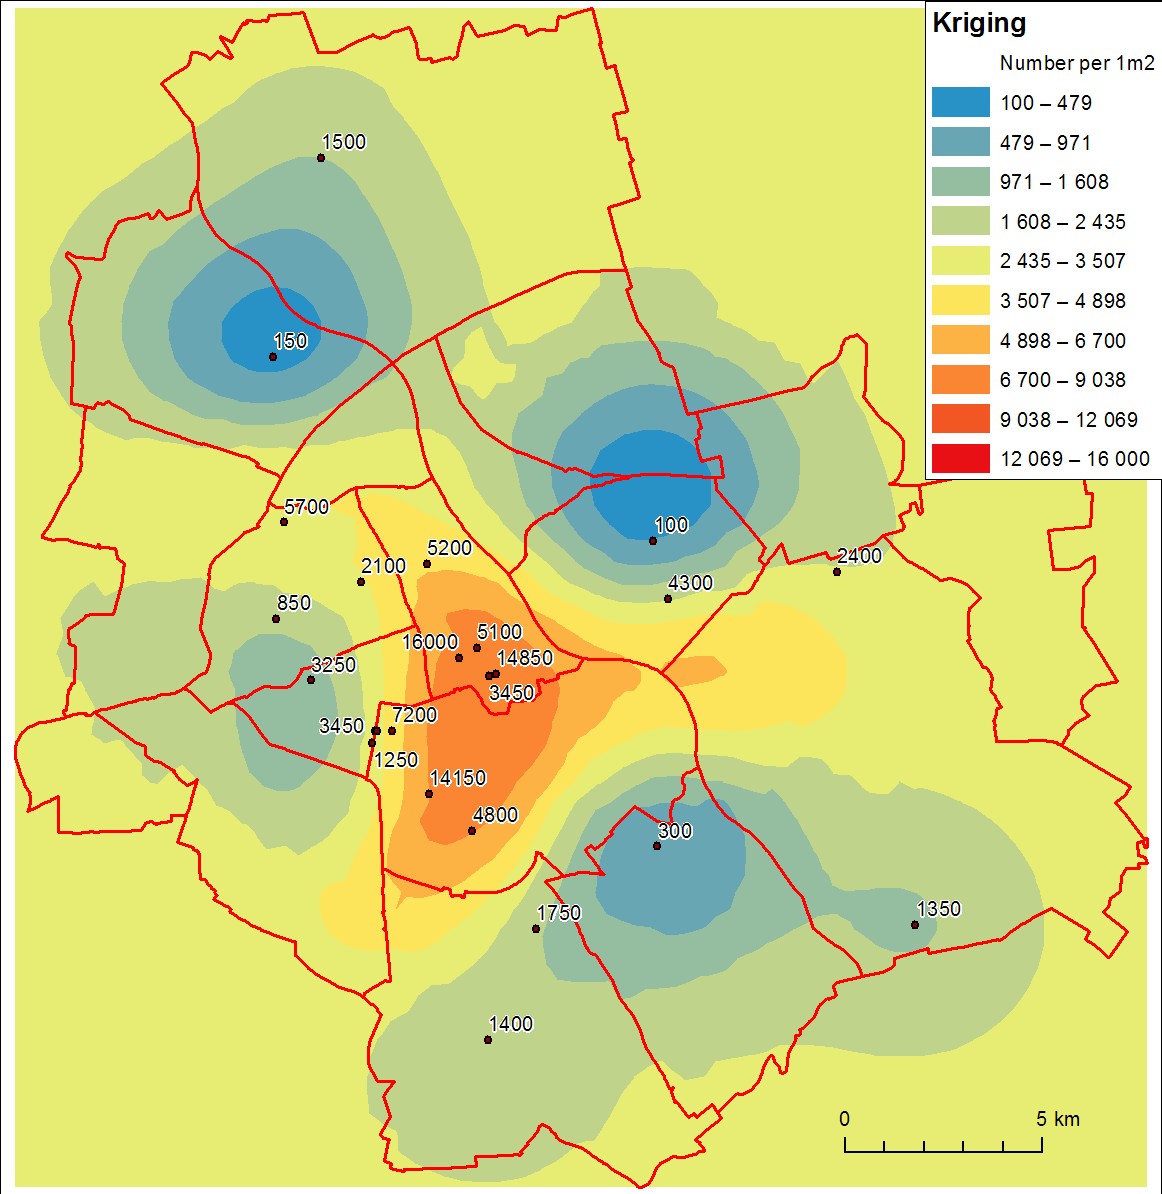
After some investigation it appeared that kriging results (performed in ArcGIS Geostatistical Analyst with default parameters) are not satisfactory. Interpolated values are far different from measurements (especially top ones) and the surface doesn't look reliable. Here's the picture: enter image description here
I suppose that the main problem is insufficient number of samples.

How many points should we use to get reliable results?
Or maybe kriging method is not appropriate for such diversed values?

1
  • You said that "Although people have succesfully kriged as few as seven data points (in a monograph by Robert Jernigan published by the US EPA in the late 1980's),...". But I can't find this article. Can you give an open address for this article? Thank you...
    – abilici
    Commented Feb 26, 2019 at 16:25

2 Answers 2

30

When you use "default values" you aren't really kriging, you're just applying the kriging algorithm--which as you have found, is poor when used with these data.

(I will step up on a soapbox for a brief rant: in my opinion, the fastest way to get bad results with a computer program is to accept its default parameters. ArcGIS is one of the richest, most powerful environments for getting bad results this way. The moral is do not use software for important work until you understand how to control it. Down from the soapbox now...)

For kriging to work you have to conduct an intensive preliminary statistical analysis of the data known as "variography." How well this ultimately performs depends on the data as well as your geostatistical skills. (Entire books have been written about variography, including the seminal Mining Geostatistics by Journel & Huijbregts and Variowin by Yvan Pannatier.) Although people have succesfully kriged as few as seven data points (in a monograph by Robert Jernigan published by the US EPA in the late 1980's), and in principle you can krige using just two or three points (I have done this to demonstrate the algorithm), rules of thumb in the literature range from a minimum of 20 points to 100 points and the consensus appears to be around 30 points.

In your case--although you do not describe the data--you have some clear problems, including a highly skewed distribution and a distinct lack of evidence of stationarity. These require special statistical treatment or specialized forms of kriging (such as a spatial generalized linear model). You will not get good results when kriging such data until you have a very large amount of data.

The legend suggests you might be trying to create a density grid rather than actually interpolate data: although the outputs of the two procedures may look the same, they do distinctly different things and have distinctly different interpretations. You interpolate when the data are considered samples from some hypothetical continuous surface. Interpolation predicts the unsampled values. Standard examples include elevation measurements (which sample the earth's surface) and temperature measurements (which sample a "temperature field"). You compute a density when you have complete information about the amount of something and you wish to represent a smoothed version of that amount per unit area. (In contrast with interpolation, there do not exist any unsampled values to predict.) The standard example is a population density: the data are counts of all individuals within an area; the output is a map of population density.

4
  • 6
    Great answer @whuber. However, doesn't the minimum number of points also partially depend on the extent of the spatial domain and the desired grain of the prediction? If you distill it down to a sampling issue then it becomes a question of capturing the population and spatial variation in the sample. Commented Feb 11, 2013 at 18:35
  • @Jeffrey That's partly the case. The amount of data bears on two things: the kriging prediction variance (which varies across the spatial domain) and the accuracy with which the variogram itself can be estimated. The latter is often overlooked, especially in traditional treatments of kriging: it's kind of an elephant in the room. If you know the correct variogram and it has a small nugget/sill ratio and large range relative to the extent of the spatial domain, you can krige with remarkably few data, especially if they adequately sample the full range of data values.
    – whuber
    Commented Feb 11, 2013 at 19:58
  • 3
    I'm convinced that anyone using kriging should need either a good geostatistics course or have a solid GIS/statistics background. Leaning how to properly model a semivariogram requires some skill.
    – Mike T
    Commented Feb 11, 2013 at 20:59
  • 1
    The rule of thumb that I've been tought: 30 points for omnidirectional Kriging and 100 for bidirectional.
    – jareks
    Commented Feb 12, 2013 at 10:02
1

There are two separate questions, first the number of data locations to use in estimating/modeling the variogram and secondly the number of data locations to use in the kriging equations to interpolate the value at a non-data location (or to estimate the average value over a region). Assuming you are using a moving search neighborhood, more than 15-20 data locations in the neighborhood will likely degrade the results because (1) only the nearest data locations in the search neighborhood will have non-zero weights, (2) with more data locations the size of the matrix to be inverted is larger and the possibility of a an ill-conditioned matrix increase. The total number of data locations needed for kriging is dependent on the number of locations to be interpolated and the spatial patterns of those points and also of the data locations. In short, there is no simple answer to your question.

With respect to estimating/modeling the variogram it is a very different problem, see for example

1991, Myers,D.E., On Variogram Estimation in Proceedings of the First Inter. Conf. Stat. Comp., Cesme, Turkey,

30 Mar.-2 April 1987, Vol II, American Sciences Press, 261-281

1987, A. Warrick and D.E. Myers, Optimization of Sampling Locations for Variogram Calculations Water Resources Research 23, 496-500

These can be downloaded at www.u.arizona.edu/~donaldm
Your Answer

By clicking “Post Your Answer”, you agree to our terms of service and acknowledge you have read our privacy policy.

Not the answer you're looking for? Browse other questions tagged or ask your own question.