50

I have written many Python scripts using ArcPy in ArcMap 10, and so far my only means of debugging is restricted to printing messages to the geoprocessing results window using arcpy.AddMessage().

Are there any other options out there, such as setting break points?

Jason's method works great. If you have a bug in your toolbox, such as validation, your IDE probably won't be able to pinpoint the problem because toolboxes are encoded. At least WING wasn't able to pinpoint it.

0

5 Answers 5

39

Usually Python debuggers/IDEs assume the Python script is running in the same process as itself so debugging a script running in ArcMap.exe is right out -- you need to get enough of the GP scripting environment bootstrapped in a Python script as you can to debug with.

A method that's worked very well for me over the past few years is to write a simple script that just calls the tool and use that as my main script in the Python IDE (Wing or Pythonwin) and have my breakpoints set in the tool's .py file also open in the same IDE session.

So basically I do this:

  1. Get the set of inputs that aren't working in my script tool
  2. Open a simple .py file in the same folder as the .tbx that calls the tool
  3. Open up the caller script and the script tool .py file in the IDE
  4. Set breakpoints in script tool file
  5. Run the caller script

And my caller script is usually pretty simple:

import os
import arcpy
arcpy.ImportToolbox(os.path.join(os.path.dirname(__file__), 'my.tbx'))
arcpy.MyToolThatIsFailing_myalias("inputs", "that", "don't" "work")

I've tried winpdb to debug scripts running in ArcMap but I've never had any luck. If you want to try it out and you get it working well, please share your findings.

0
26

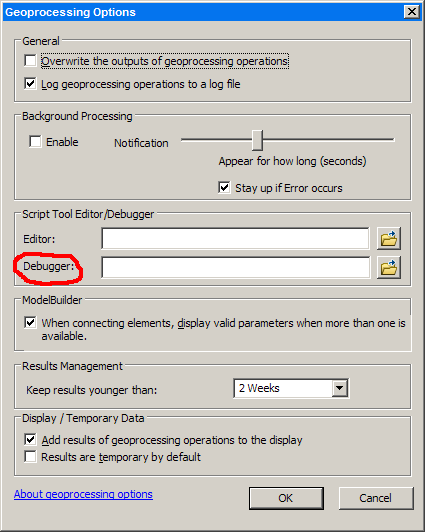
From ArcGIS 10, you can change it from the GP options dialog, just point to your executable of choice for editor/debugger.

GP Settings Dialog

0
9

For users of 10, clearly the best route to go is with Jason's post, which I marked as the "best answer". For users of 9.3, I was able to follow the ESRI KB Support instructions linked in Brad's post to get it working.

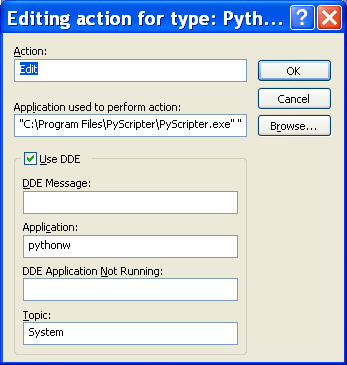
Ultimately the key to get to default editing of ArcGIS python scripts in Pyscripter was to edit the system "action" for "registered file types" ending in *.py files (step #4). I created a new "Edit" action type and then included the Pyscripter.exe path. Once I did this, the default edit action was setup to launch Pyscripter instead of IDLE.

The string I used (because it was cut off in the dialog box shown below) is:

"C:\Program Files\PyScripter\PyScripter.exe" "%1"

enter image description here

0
7

I don't know how this will work with arcpy, but you can try pdb:

import pdb; pdb.set_trace()
0
0

The most straight forward way I have found to debug my code is to hard code my inputs to an existing dataset's file path. For example:

import arcpy

# parameters for script
#input1 = arcpy.GetParameterAsText(0) # layer
#input2 = arcpy.GetParameterAsText(1) # folder

# debugging parameters
input1 = r"path/to/your/data.shp"
input2 = r"path/to/your/folder"

In addition to the results window, the python window yields helpful error messages and/or allows you to test code snippets.

Any good IDE has a debug probe that will have, in memory, all your processing up to the current breakpoint. With that, you can see what is going on with the data. Set breakpoints where you want to pause the script. Use conditional breakpoints if you want to stop a loop at a specific iteration. Also, know your Arc versions and what functions are available to those versions.

Your Answer

By clicking “Post Your Answer”, you agree to our terms of service and acknowledge you have read our privacy policy.

Not the answer you're looking for? Browse other questions tagged or ask your own question.