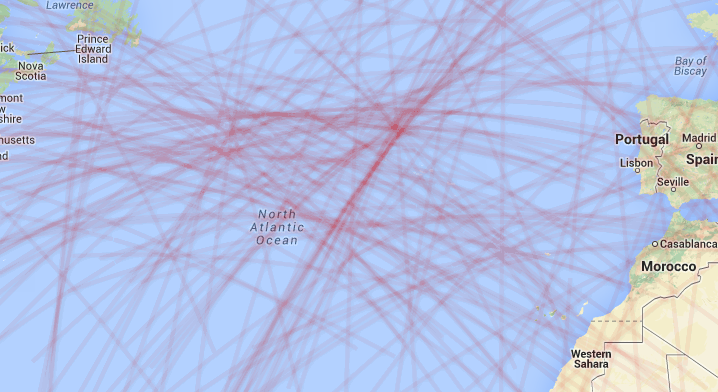
Using ArcGIS 10.1, I am interested in symbolizing a series of polylines to generate a pseudo-heatmap like one of the answers to this question.
The essence of the solution idea is to symbolize each polyline as red center, green border, and set the individual line transparency to 20%. Using ArcGIS, it is trivial to set the entire layer transparency, but then the cumulative, low alpha, overlaps never sum to an opaque level.
Is it possible to set opacity / transparency at the symbol level and not the layer level?
Similar to Displaying transparent overlapping polygons in ArcGIS for Desktop?, but I am interested in polyline and using color, instead of hatching.
Edit
I have tested the ability to do this in two ways:
If I buffer the polyline and add a transparency field, I can directly set transparency for each layer. Unfortunately, this still appears to 'flatten' the symbology, i.e. the cumulative alpha of overlapping polylines is lost.
By exporting 4 of the polylines, known to overlap, it was possible to manually set the transparency (on the layer) to 80%. When all layers are viewed the cumulative alpha is displayed as anticipated, i.e. two overlapping lines are 'darker' (40% opaque).
As an aside, I tested this using a google fusion table and the result is as expected, i.e. alpha is per line and cumulative for overlapping symbols. This can also be done in OpenLayers, but that removes the step from my ArcGIS workflow (and more importantly, my users ArcGIS workflow).

Edit 2
I was able to accomplish this manually in ArcGIS using the following workflow. This is non-ideal as it requires a duplication of the layer n times, where n is the number of features.
- Copy the layer and paste to the same dataframe.
- Define a definition query on a unique field. In my case I used a grouping: `"id" >= 20 AND "id" < 30.
- Repeat 2 until all features are in their own layer...
- Add the features to a New Group Layer
- In Group Layer Properties select Symbol Levels
- Check 'Draw this layer using the symbol levels specified below'
- Manually check Merge for each layer
I suspect that the above workflow can be automated as a python add-in. I will need to explore that next.
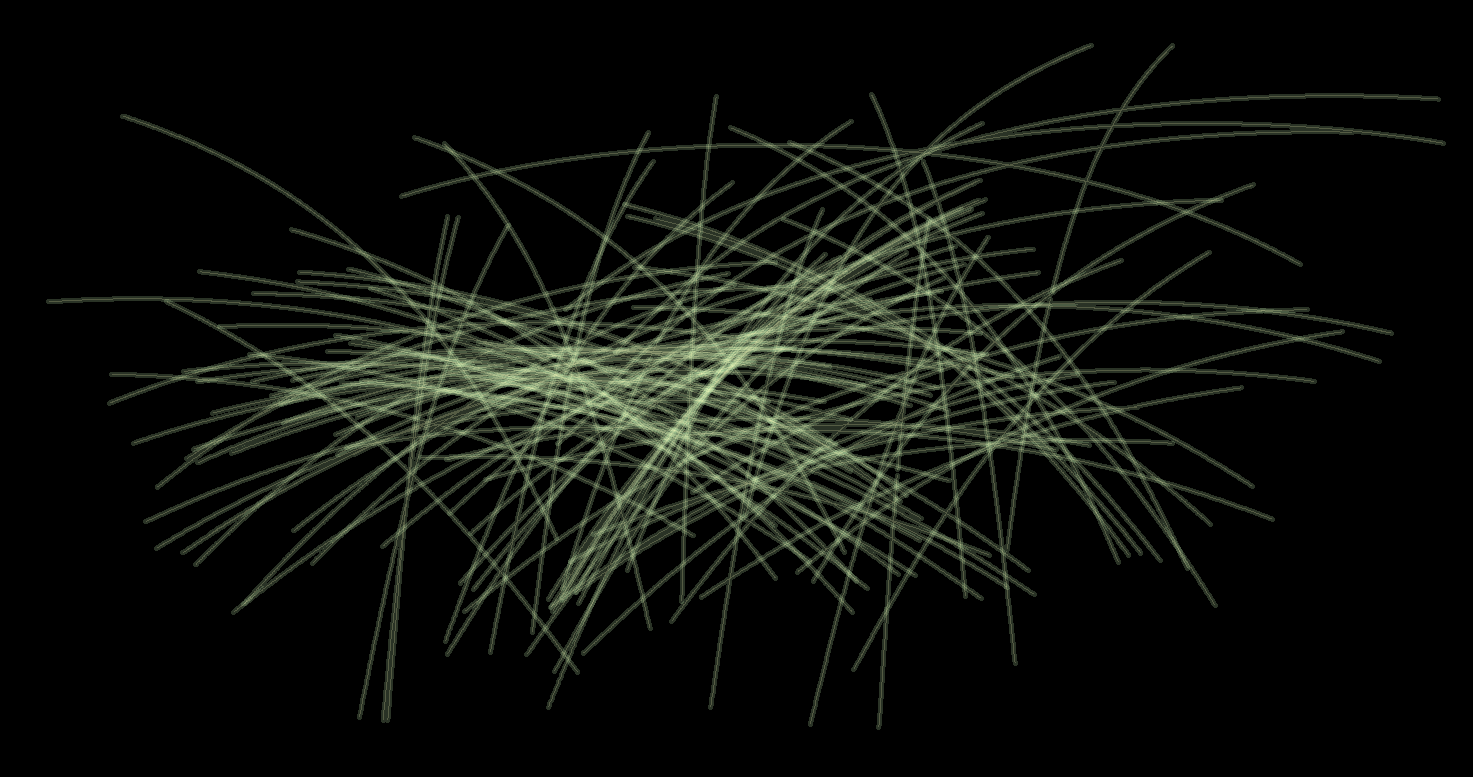
Result with black background:

