10

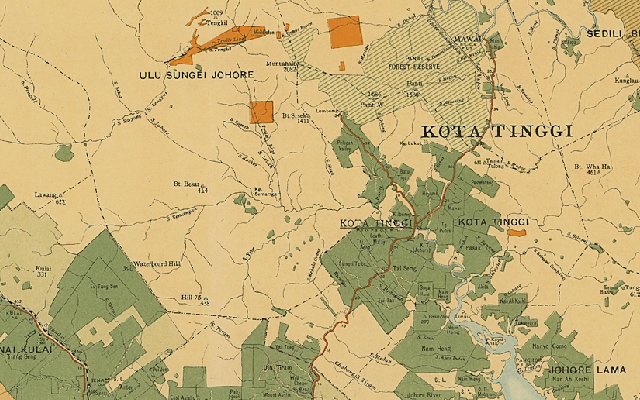
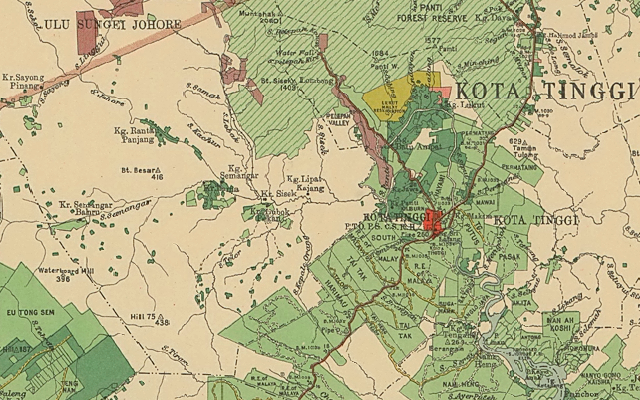
I am a relative beginner to using GIS, and am running QGIS 2.0.1 in Linux. I have two historical maps which I want to analyze, that show land use patterns in the same area at two different moments in time. I have them scanned and geo-referenced as layers in one file. Side by side, they look like this:

1930 1950

The main thing I am interested in is to compare the extent of the light and dark green areas between the two maps. Is this possible, and if so, what is the simplest approach? Is there a way to do this based on raster analysis? And if I have to make a shapefile, what is the best way to do that?

What I have already considered:

  • Drawing shapefiles as polygons by hand, as described in this tutorial. That would be VERY tedious.

  • Creating simplified, high contrast raster images by using color selection, filters etc. by trial and error in the Gimp and converting that to a shapefile. The results were very sloppy.

7
  • 6
    welcome to the tedious and sometimes very boring world of GIS ;) In case you do not need to digitize every single parcel but can agglomerate the same coloured pieces, this is just a matter of some hours of meditative mouse-pushing. All other experiments will fail, i fear! If you had just clean colour patterns in your scan, you could convert them to grayscale with the raster calculator and vectorize them, but getting rid of all the letters and unnecessary elements AND refilling their place with proper values looks impossible to me.
    – Bernd V.
    Commented Sep 16, 2013 at 19:22
  • Thanks @BerndV. Bad news, but helpful to know. And by "mouse-pushing", you mean drawing each polygon, completely from scratch, as described in the tutorial I linked to, and that trying to get an approximation automatically that needs extensive repairs is probably not a viable shortcut?
    – Brian Z
    Commented Sep 16, 2013 at 20:05
  • 3
    These images are hard to process. If the lettering were the only problem, it would be easy to solve. However, on close examination (a) the originals are problematic due to hatching to distinguish types of land cover and (b) extensive digital compression artifacts make the colors much less uniform than they might appear. The raster processing route would be easier with a higher quality scan and lossless compression.
    – whuber
    Commented Sep 17, 2013 at 2:13
  • as whuber suggests above for normal rasters it is easy to select the areas of a specific areas using the value tool and the raster calculator....if using the value tool you can establish if there is a specific value for the green areas then let us know.
    – Ger
    Commented Sep 17, 2013 at 12:01
  • @GeraldO'Reilly, if I posterize the second image in GIMP, the dark green becomes pure green (255,0,0) and the light green becomes pure yellow (255,255,0). There are definitely artifacts however (e.g. stray pixels of green or yellow where I don't want them). I imagine there is a way to use the raster calculator and set a tolerance value or somehow smooth out the pixels a bit?
    – Brian Z
    Commented Sep 17, 2013 at 15:18

4 Answers 4

9

Posterizing was a great start: it eliminated most of the compression artifacts and simplified the cartography enough to enable additional cleaning.

Much of the cleaning of a categorical raster involves so-called "morphological" operations. These include expanding one category into its neighbors, shrinking it back again, and region grouping contiguous mono-categorical cells into their own categories.

Usually some experimentation is needed, if only because the artifacts to be removed--lettering, hatch lines, and so on--will vary in their pixel sizes from one scan to another. To get you started, I will illustrate what these procedures can accomplish on the example.

The original, after posterization, looks like this. It's a grid with just three categories shown in three colors. We aim to create a grid in which the dark green areas are made into contiguous pieces, without the overlettering or dots or irrelevant line work, suitable for later analysis using raster algebra.
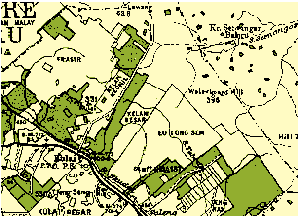
Figure 1

Expanding the dark green areas just one pixel into all surrounding areas gives this image:
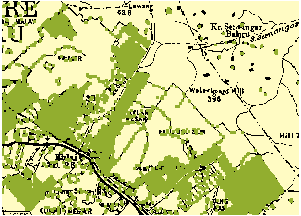
Figure 2

(For more precise control you might want to limit expansion into just the black areas if your GIS allows it.)

To eliminate a lot of the thin lines of green artifacts and little islands, let's shrink the green back inwards by two pixels
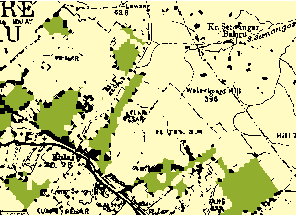
Figure 3

and then, to balance all the expanding and shrinking (to reduce the bias) we will expand it back one more pixel:
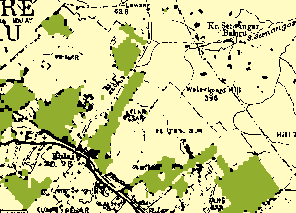
Figure 4

Region grouping identifies these contiguous patches of green:
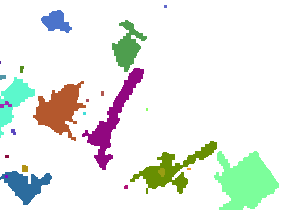
Figure 5

Each different patch is shown in a different color.

Use a conditional or SetNull operation to eliminate the tiny patches. How tiny? I inspected the attribute table and found that many patches occupied between 6 and 47 cells; after that there was a jump to 422 cells. I chose a threshold within that jump (100) and erased all cells with counts (not values!) less than that threshold. Here is what remained, overlaid on the original for comparison:
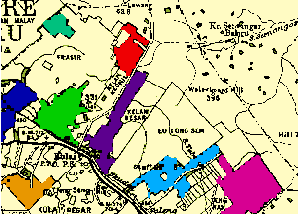
Figure 6

We have achieved a fairly fine-grained representation of the areas of interest, suitable for detecting and quantifying changes relative to similarly processed images. I took some work, but it's far less work than manually digitizing the original scan, and--provided the scans are made at consistent resolutions--can be semi-automated. (Because the original maps use different colors, some intelligent intervention has to occur at the outset to select appropriate colors for expanding and shrinking.) Each one of the steps is a fairly fast calculation, too, so you can probably afford to scan the original maps at extremely high resolutions for greatest precision.
1
  • These results look very good, I'll see if I can recreate them. Thanks @whuber!
    – Brian Z
    Commented Sep 18, 2013 at 20:38
2

Getting an approximate raster layer in Gimp and converting it to vector in QGIS probably saved me some time, but it looks like there is no way to avoid hours of cleaning up the resulting shapefiles, vertex by vertex.

1

Ok, maybe this will work, maybe it wont. depending on the quality of the scan. you can set the transparency of a particular colour to a percent or you can use the value tool to isolate the colour you want.

I am not going to take the credit for this as i asked a question before...mine was actually wanting to select houses of open street view mapping. So let me know if it helps.

Identify Polygons on raster image

Let me know if it helps....i can delete if it is off the point completely.

1
  • I had seen this answer at one point but then couldn't find it again, so thanks for posting! I think the quality of these images mean that this approach won't quite cut it on its own, but it's helpful as a hint on how the expression eval works.
    – Brian Z
    Commented Sep 18, 2013 at 15:26
0

In Gimp you have some selection tools that may make your work easier.

I think to the fuzzy selection tool (selecting by color area) which you can set to be more or less sensitive to colour variation (Using the first image you uploaded, I got good results with a threshold value of 13,0). This way I get quite clean result without a lot of parasites which then can be easily and quickly removed selecting a rubbing tool

Once selected, you may recolour these areas with high contrasted colours, reimport into GIS and then vectorize ?

But this will not solve the problem pointed out by whuber about the hatched land area, but since they are not much of them, maybe you can vectorize them from scratch without to have to spend a lot of time to do it ?

1
  • 1
    Unfortunately the images above are just tiny samples within a huge map area. But I can still use a similar approach with the Color tool, smoothing it out with Blur and Threshold filters. The results are pretty decent on the older map (the top one above). And fortunately I don't care as much about the crosshatched areas as the solid ones.
    – Brian Z
    Commented Sep 18, 2013 at 3:29

Your Answer

By clicking “Post Your Answer”, you agree to our terms of service and acknowledge you have read our privacy policy.

Not the answer you're looking for? Browse other questions tagged or ask your own question.