5

I have a conundrum with Focal Statistics and kernel files. I am been trying to identify saddle points in DEMs. I am attempting to rewrite this (thanks whuber) in a python script for 10.1. I have used focal statistics and kernel files for irregular neighborhoods in the past with no issues. Now, for some reason, I continuously get the following error:

ERROR 010308: Invalid Irregular neighborhood mask

My script is below:

# Import system modules
import arcpy, os, codecs
from arcpy import env
from arcpy.sa import *

arcpy.CheckOutExtension("spatial")

# Obtain parameters
dem = arcpy.GetParameterAsText(0)
outFolder = arcpy.GetParameterAsText(1)

arcpy.env.workspace = outFolder
DEM = Raster(dem)
kernel = os.path.join(outFolder, "kernel.txt")

# Compute the neighborhood sums involved in estimating the second partial deriviatives.

arcpy.AddMessage('Attempting FocalStat 1...')
n1 = NbrRectangle(3, 3, "CELL")
g1 = FocalStatistics(DEM, n1, "SUM", "NODATA")

arcpy.AddMessage('Attempting FocalStat 2...')
n2 = NbrRectangle(1 , 3, "CELL")
gX = FocalStatistics(DEM, n2, "SUM", "NODATA")

arcpy.AddMessage('Attempting FocalStat 3...')
n3 = NbrRectangle(3, 1, "CELL")
gY = FocalStatistics(DEM, n3, "SUM", "NODATA")

arcpy.AddMessage('Attempting FocalStat 4...')
text = codecs.open(kernel, "w", encoding='ascii')
text.write("3 3\n1 0 0\n0 0 0\n0 0 1")
text.close()
n4 = NbrIrregular(kernel)
gM = FocalStatistics(DEM, n4, "SUM", "NODATA")

arcpy.AddMessage('Attempting FocalStat 5...')
text = codecs.open(kernel, "w", encoding='ascii')
text.write("3 3\n0 0 1\n0 0 0\n1 0 0")
text.close()
n5 = NbrIrregular(kernel)
gP = FocalStatistics(DEM, n5, "SUM", "NODATA")

# Delete kernel txt
os.remove(kernel)

# Compute the determinant of the Jacobian.
# It is multiplied by 10^6 to bring it into a range that SA can display.
arcpy.AddMessage('Calculating determinate of the Jacobian...')
xCell = arcpy.GetRasterProperties_management(DEM, "CELLSIZEX").getOutput(0)
g = (g1 - (gX * 3)) * (g1 - (gY * 3)) / 9.0 - (((gP - gM) / 4.0)**2) / (int(xCell)**4 / 1000000)
g.save("JacobDet.img")

I have tried using the focal stat tool in arc with a standalone txt file with the same results.

Is there something wrong with my code/kernel file?

7
  • 2
    Could you post the contents of your kernel.txt file(s)?
    – Conor
    Commented Sep 18, 2013 at 15:51
  • 1
    @Barbarossa, is it really saddle points specifically that you're after or whole ridge line networks?
    – user21951
    Commented Sep 18, 2013 at 18:00
  • kernel.txt files are created by the script "text.write(...)" see above
    – Barbarossa
    Commented Sep 18, 2013 at 19:31
  • 2
    Yes, but the reason @Conor asks for an example of one of those files is that clearly the error is due to some problem with their contents. It could be as simple (and ridiculous) as lack of a terminal "\n" before the EOF marker: ArcGIS is notoriously unforgiving about reading files (and just as bad about not offering clear, unambiguous documentation about the expected file structure).
    – whuber
    Commented Sep 18, 2013 at 20:08
  • 2
    @whuber is correct. Your text.write() script is likely adding some invalid characters or whitespace that is causing your read to fail. See the link at end of this comment for more information on formatting for kernel files. If your formatting is OK but the problem still persists, try these two suggestions based upon my dealings with kernel files in the past: 1) Make sure your kernel.txt is ASCII encoded, not UTF-8. 2) Make sure your filepath referencing the kernel.txt file is correct. Link: webhelp.esri.com/arcgisdesktop/9.3/…
    – Conor
    Commented Sep 18, 2013 at 20:30

3 Answers 3

7

If what you are looking for is to divide the landscape into it's skeleton networks of valley lines and ridge lines, then I'm afraid that any method that you use that is based on surface curvature is likely going to be unsatisfactory. They are based on local elevations and are so heavily influenced by individual elevation error that they produce too much noise. Smoothing the DEM can help with this, but it presents a whole other set of problems. I would instead suggest an approach that is based on flow pathways. It is well known that you can derive a valley network easily by thresholding the contributing area image:
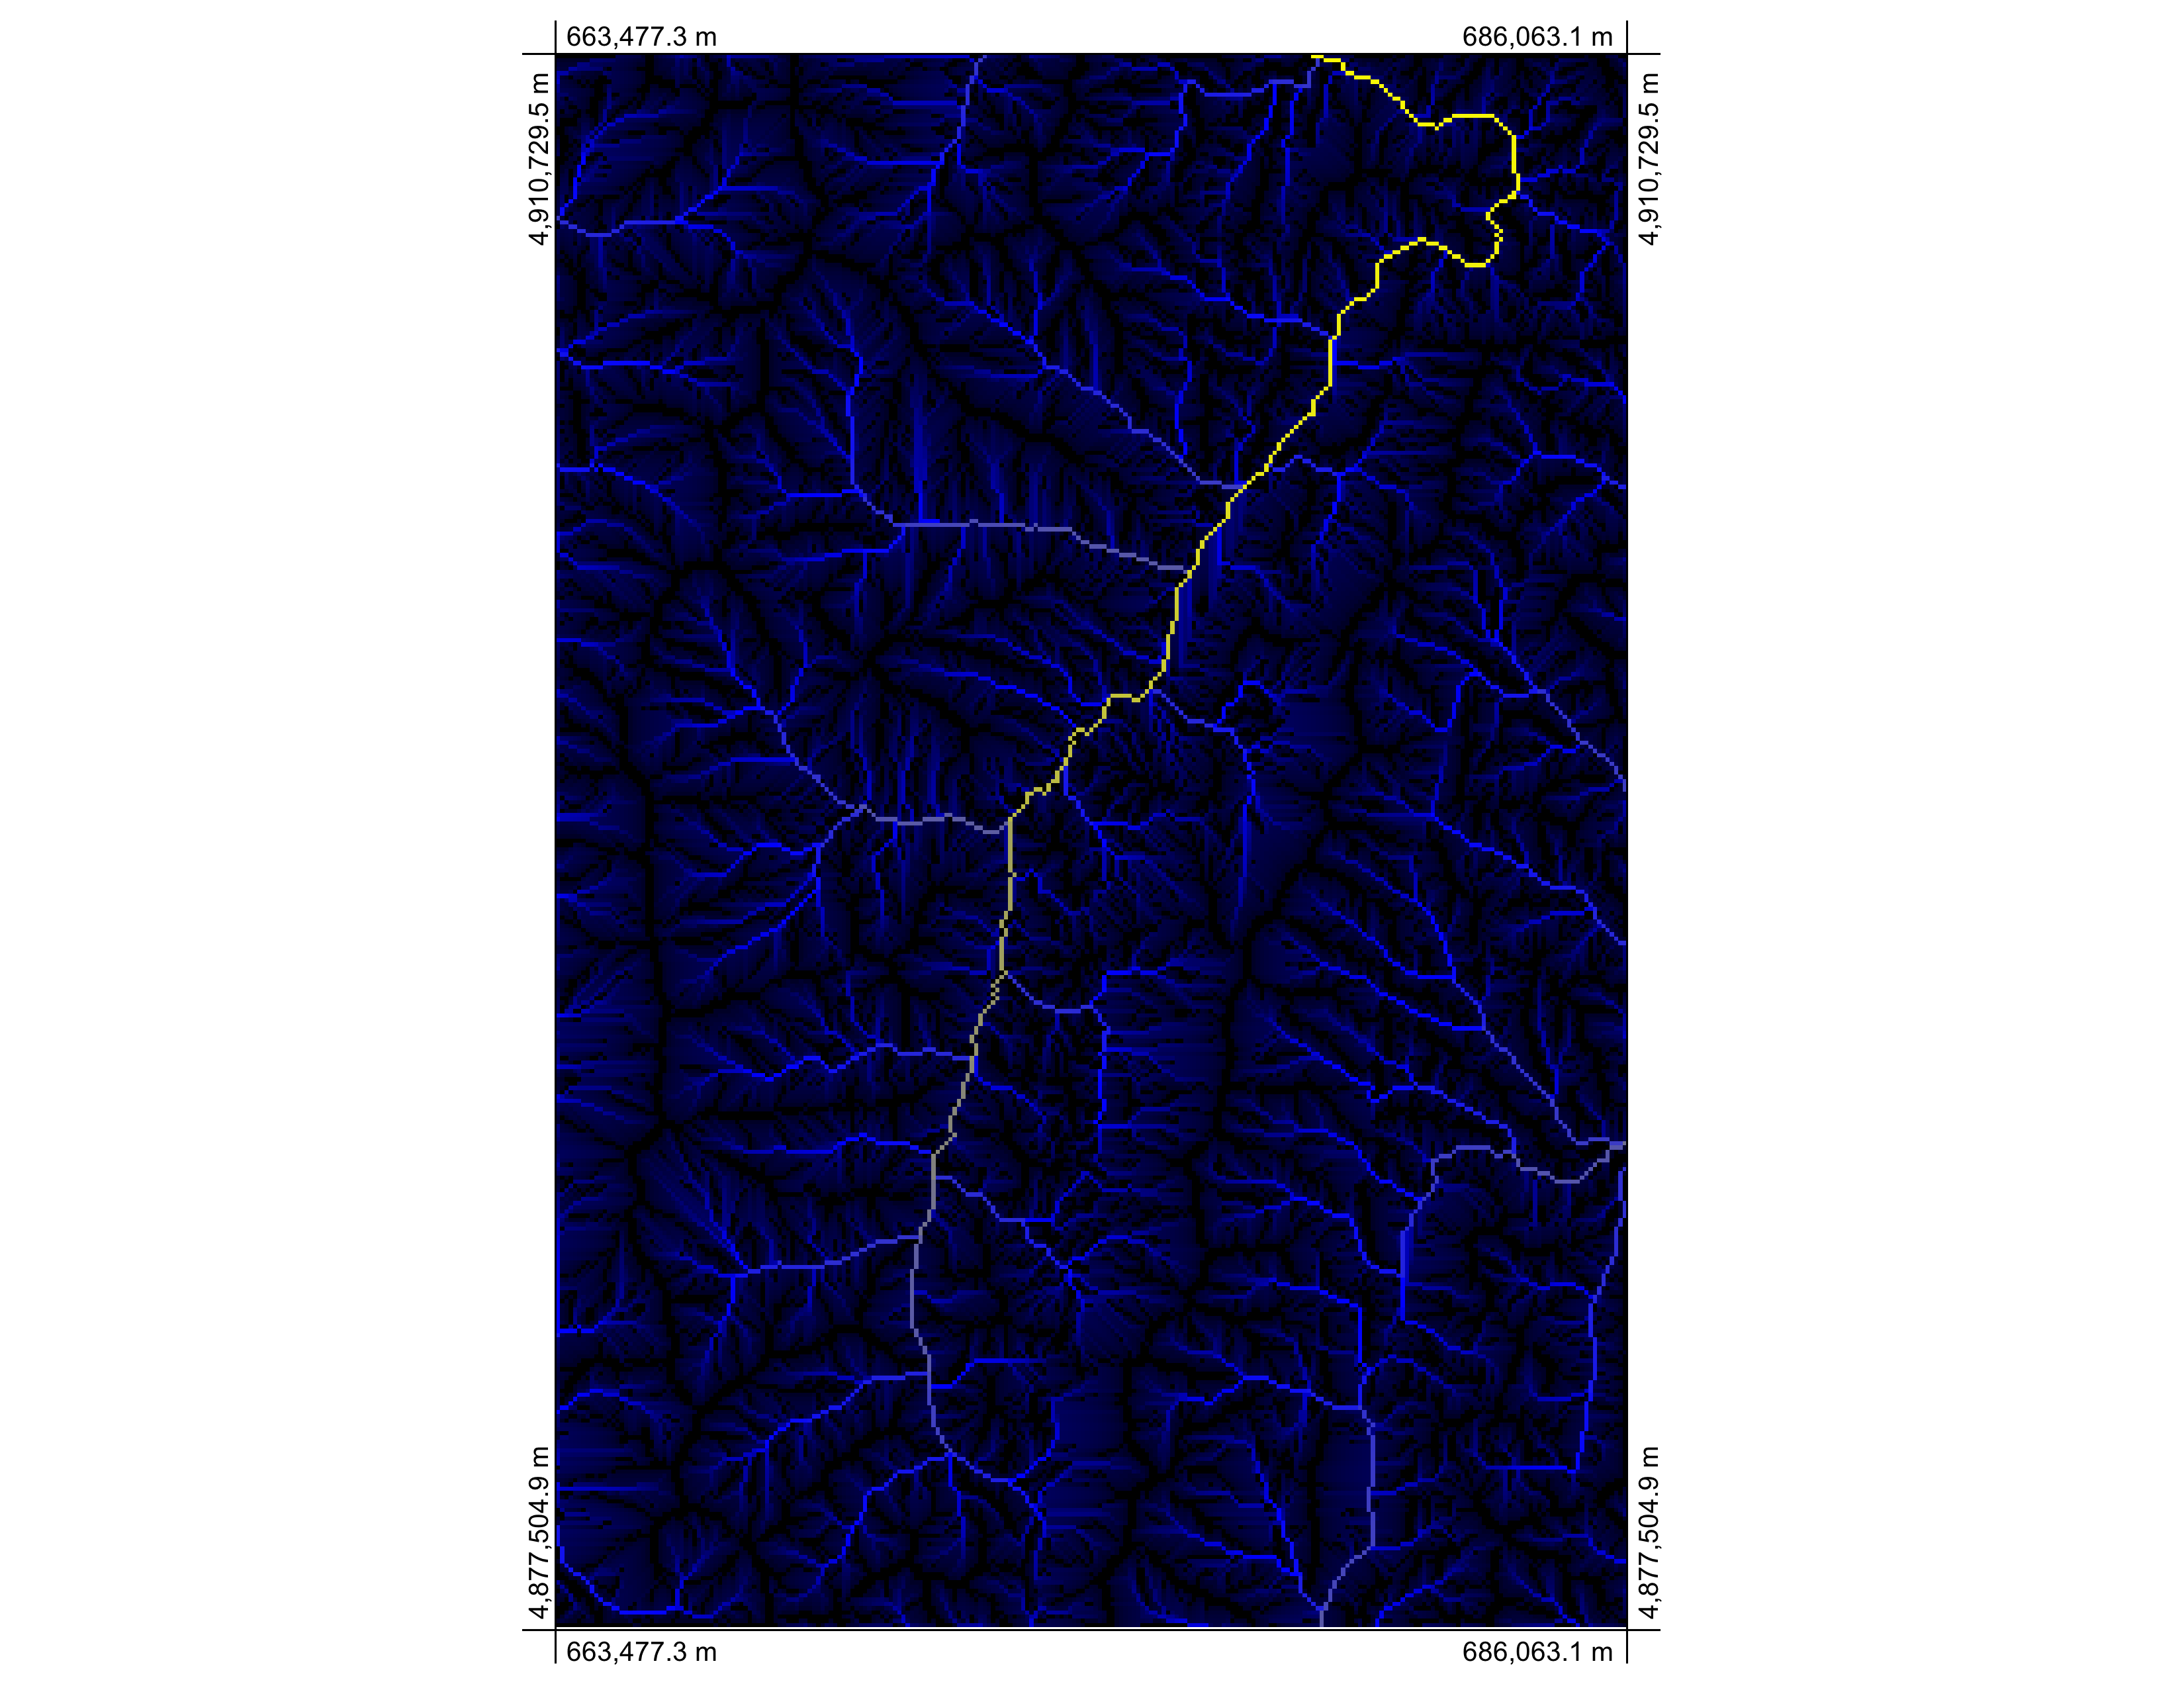
enter image description here

I recently wrote an article (Lindsay and Seibert, 2013, Measuring the significance of a divide to local drainage patterns, International Journal of Geographical Information Science, 27:7) in which I describe a new topographic attribute called maximum branch length, which is the compliment to contributing area for ridge line networks:
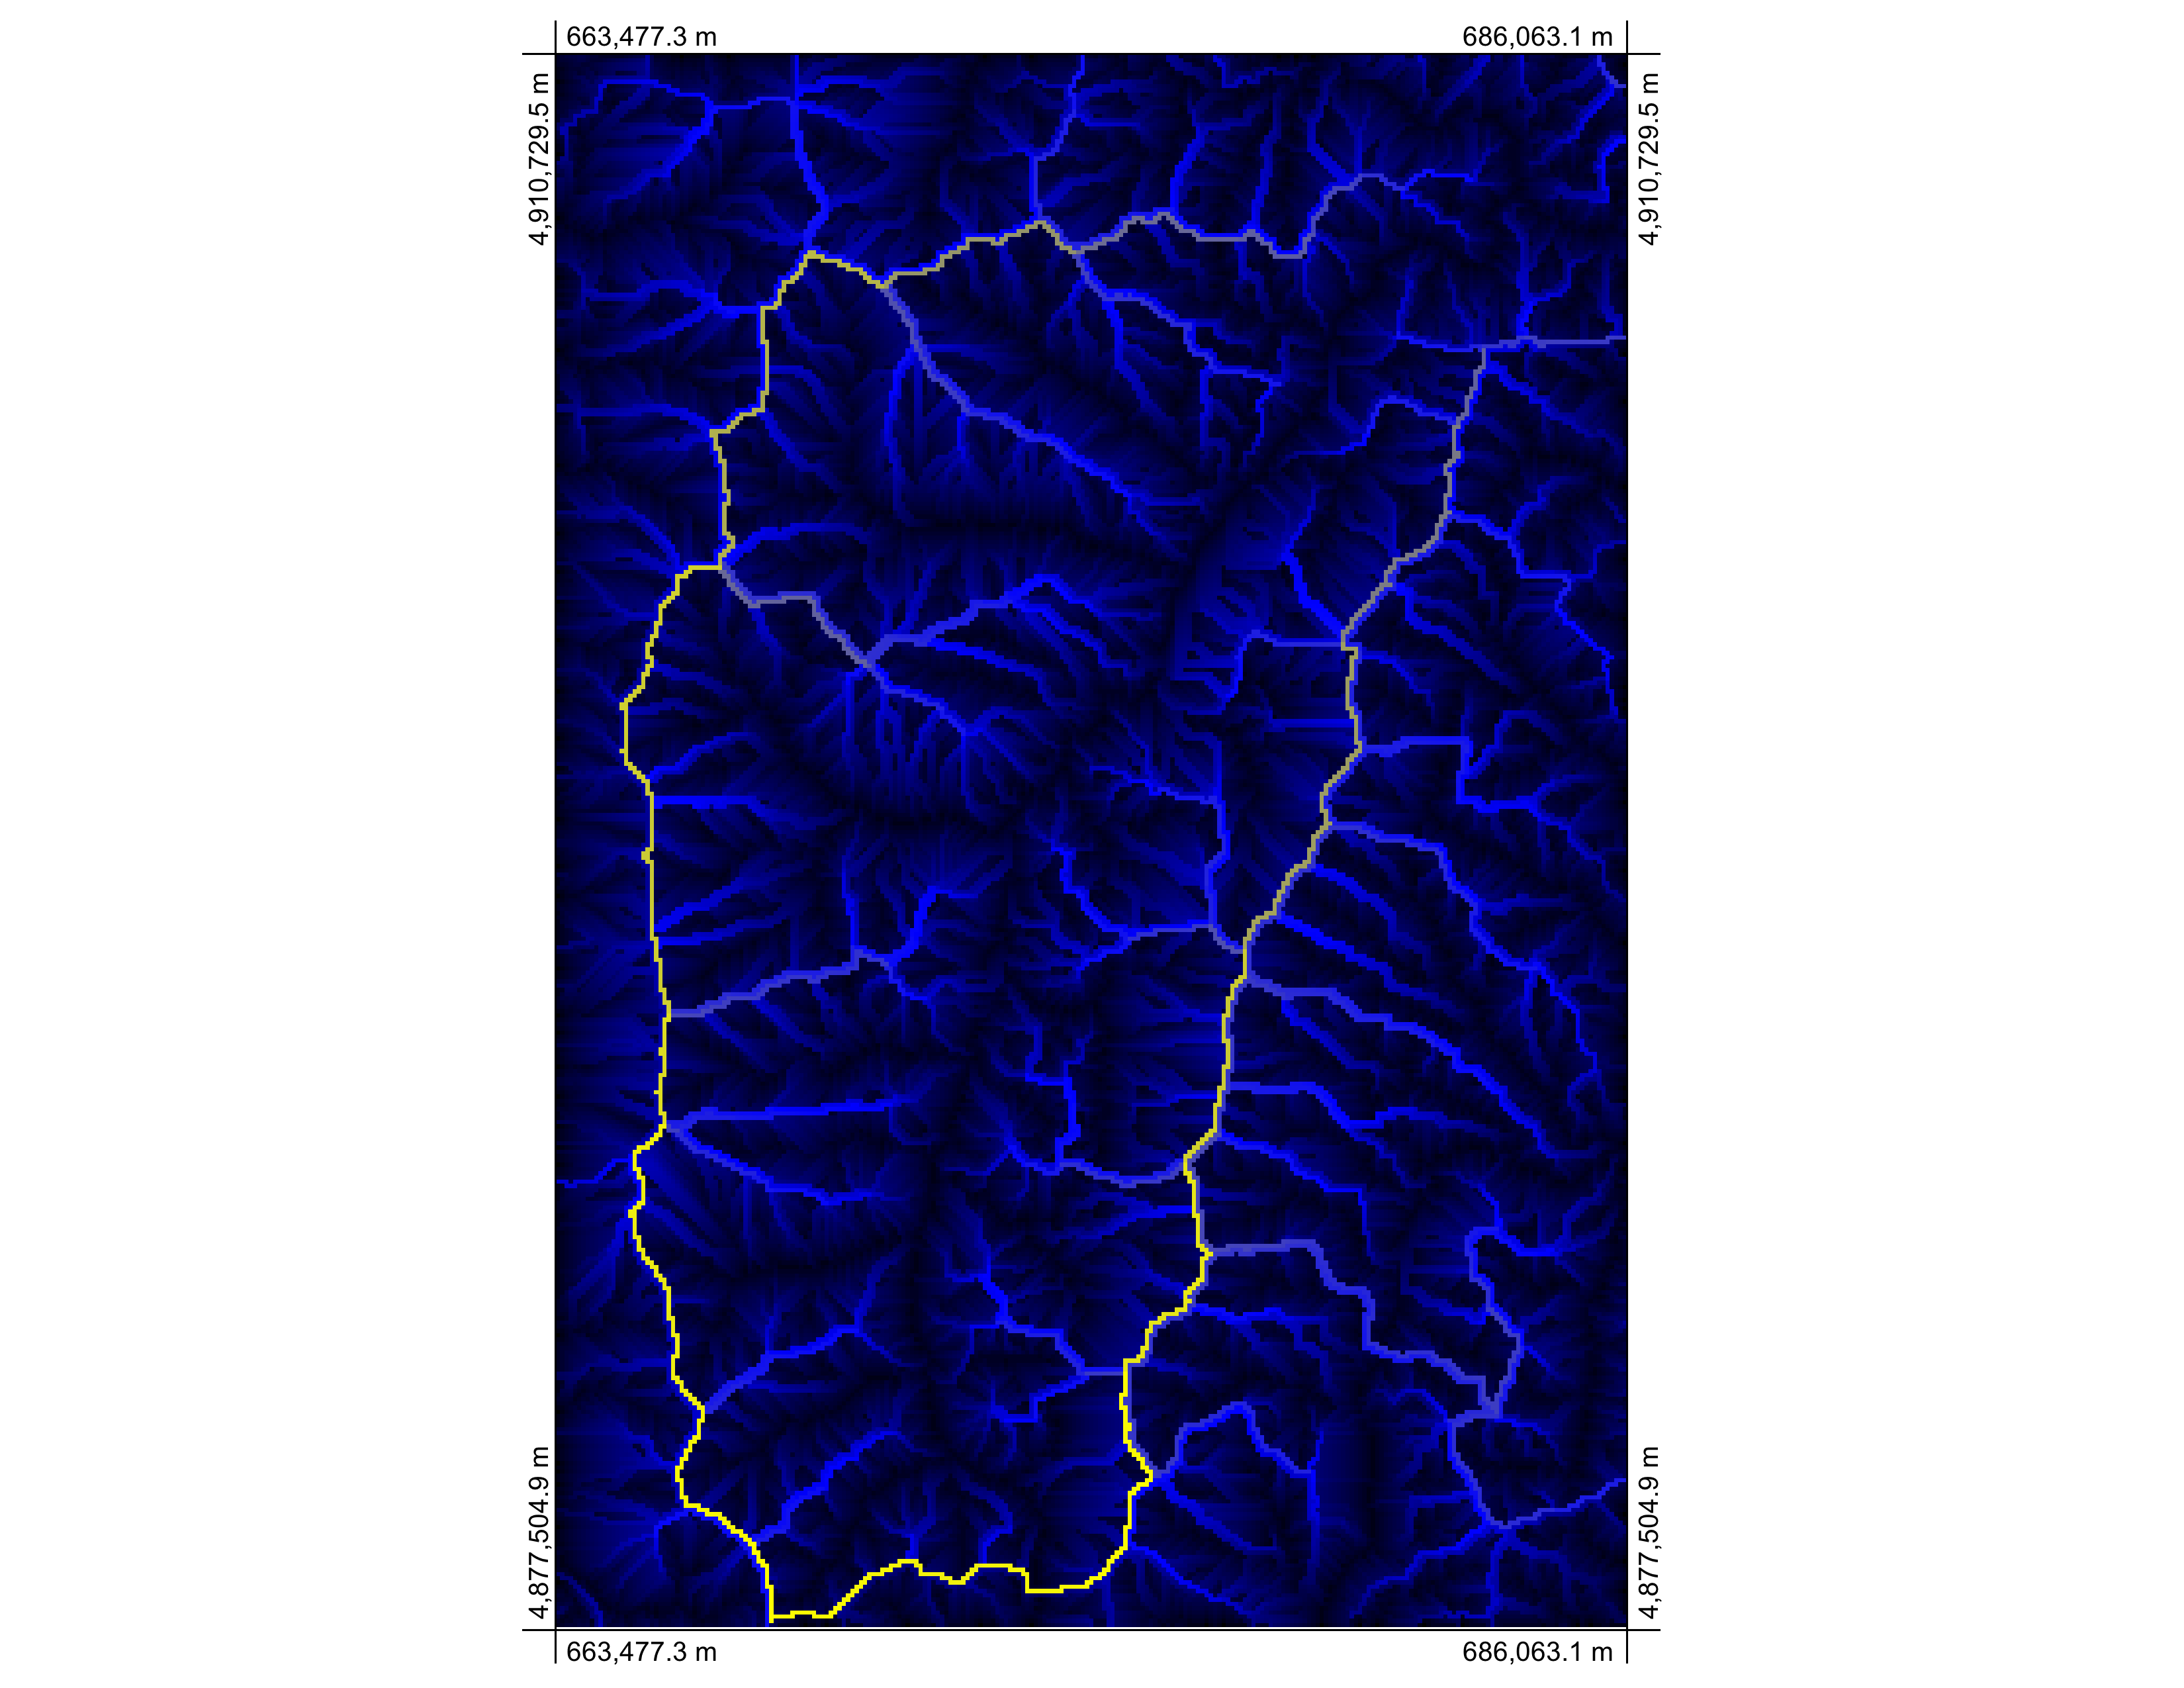
enter image description here

The maximum branch length tool can be found in the open-source GIS Whitebox GAT (http://www.uoguelph.ca/~hydrogeo/Whitebox/). Based on these two grids, it is easy to extract channel and ridge networks:
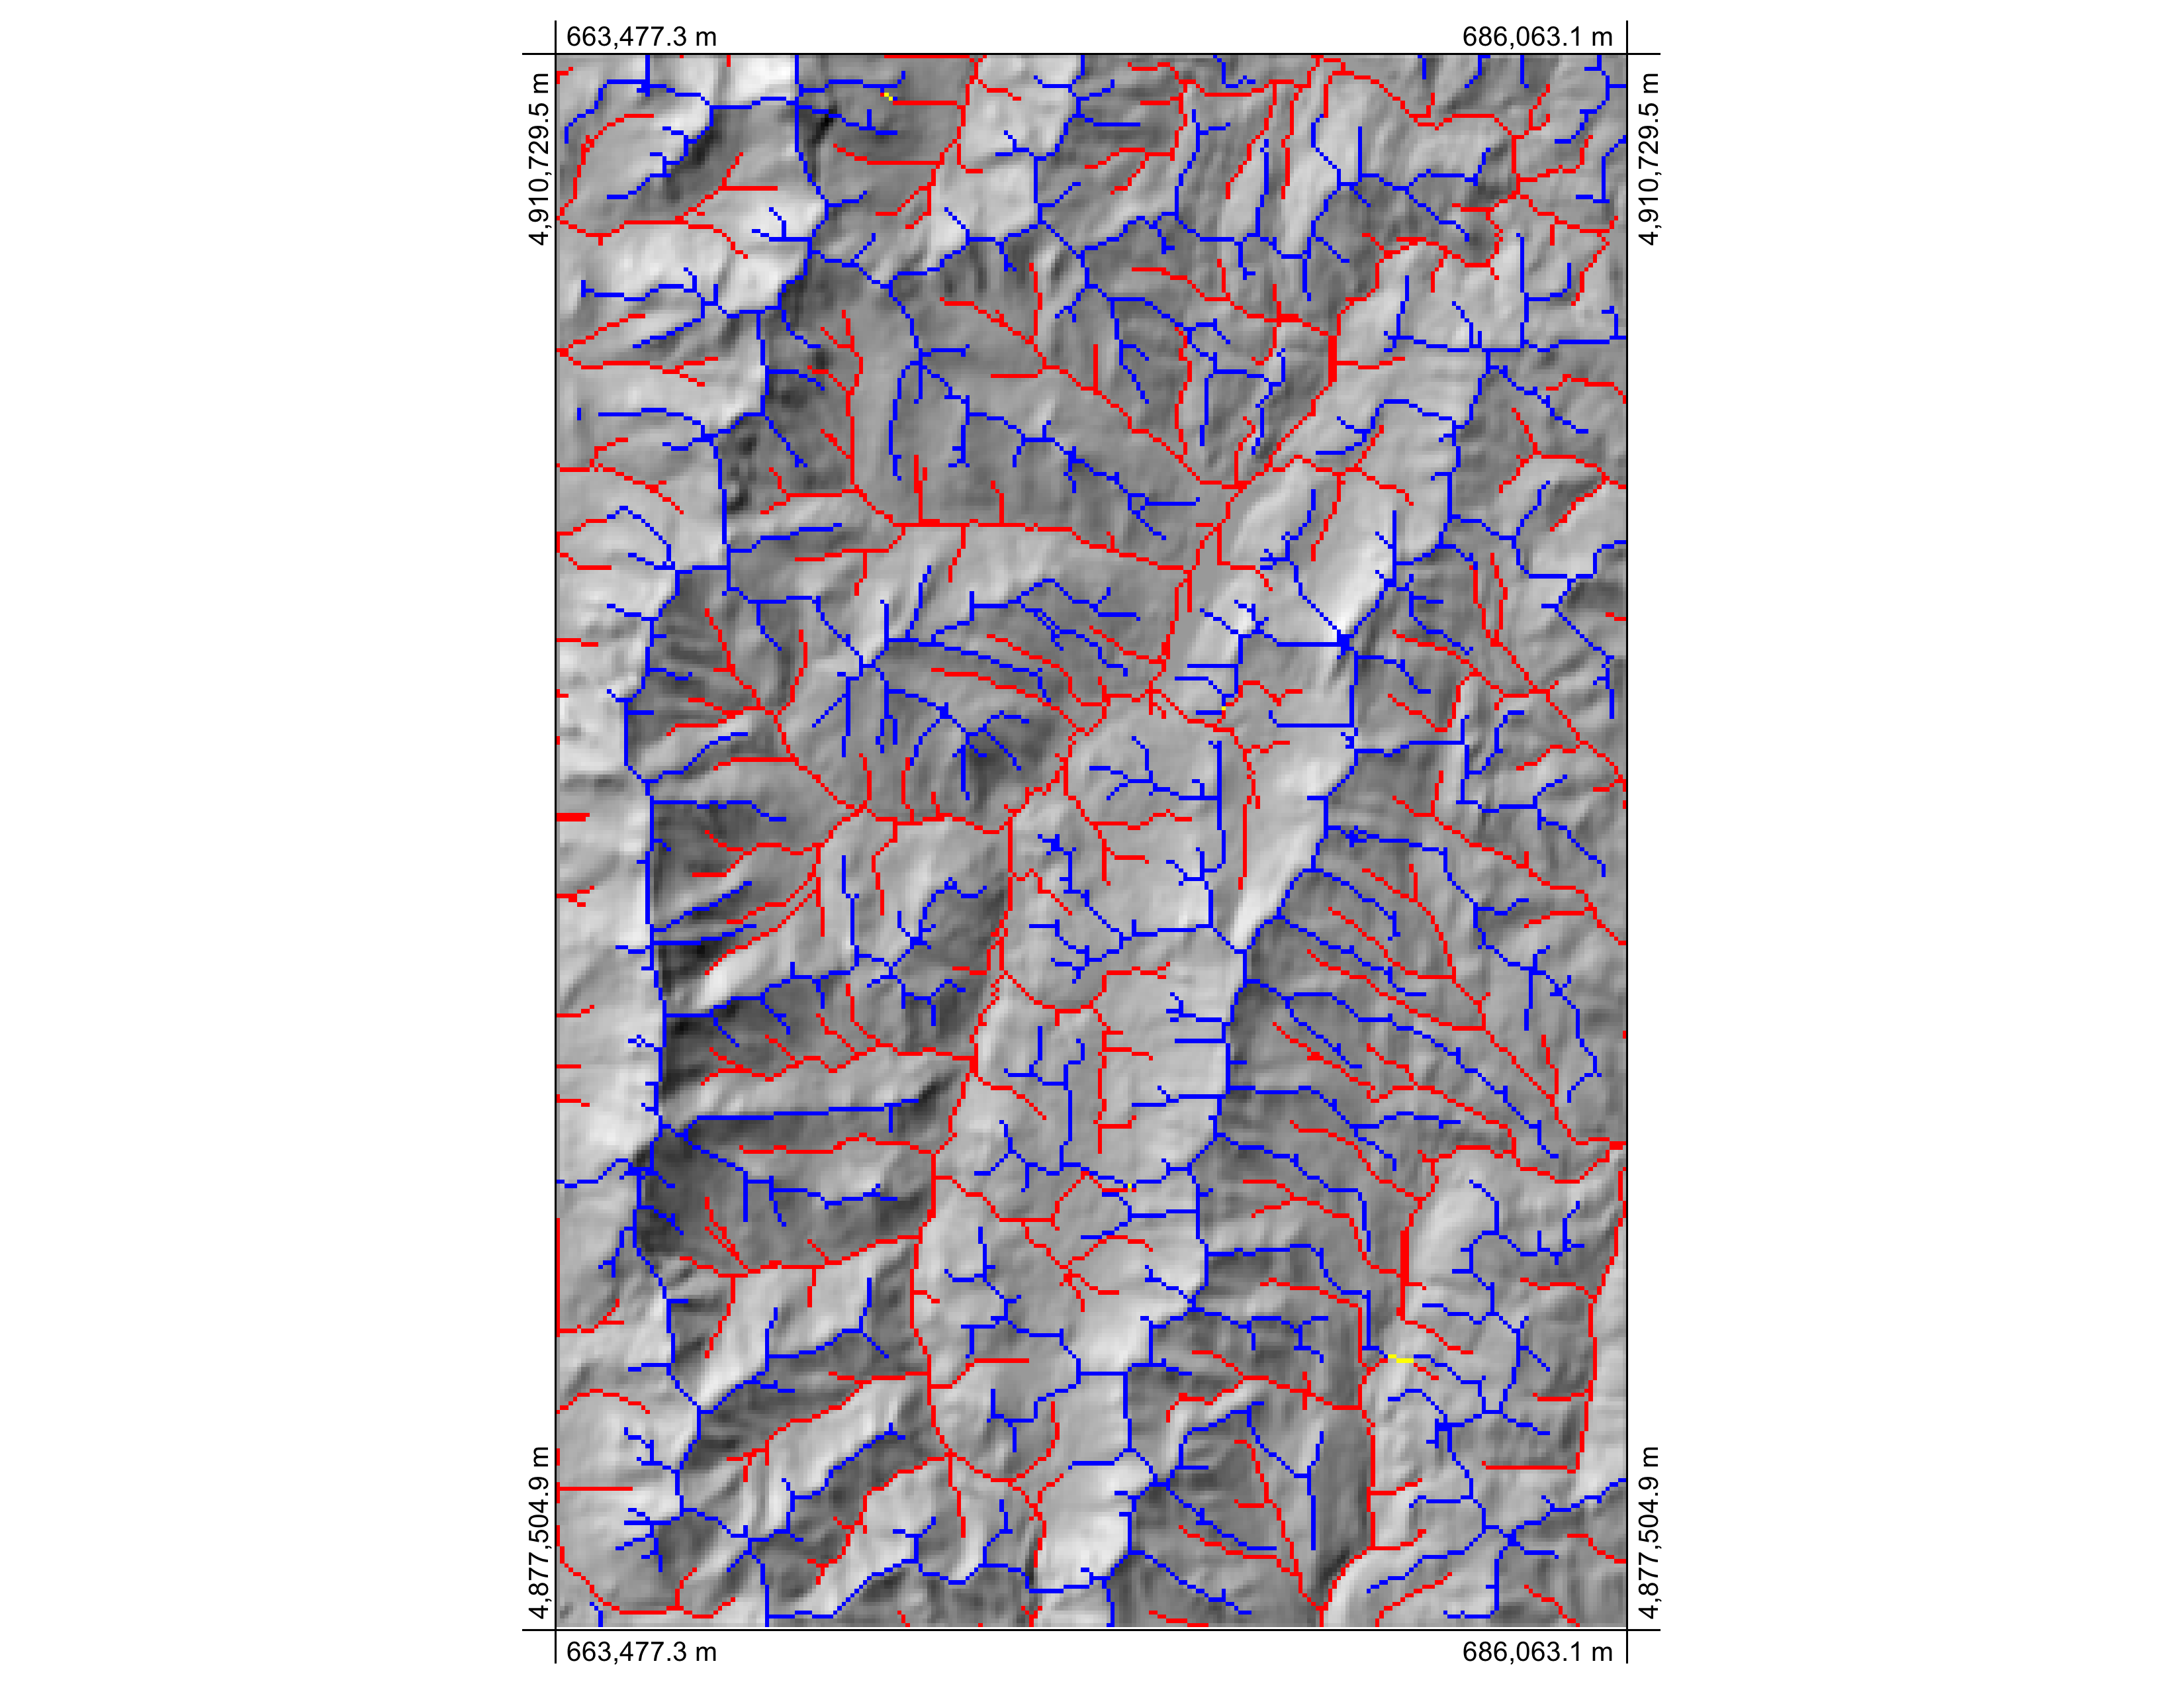
enter image description here

Applying appropriate thresholds can ensure that the networks intersect, with saddle points (and actually confluences on the valley network) being located at their intersection. This is a method that is much less sensitive to DEM error and often produces far more satisfactory ridge networks.

Here's a link describing branch length in more detail if you don't have access to the paper: http://www.uoguelph.ca/~hydrogeo/Whitebox/Help/BranchLength.html

EDIT: Okay here's a quick little Python (Jython) script that you can use in Whitebox to identify the saddle points. It's based on finding the lowest elevation located on the ridge network in each catchment area draining to a channel head. As such, there is one saddle point for each channel head. A more extensive channel network would find more saddle points and vice versa. I could probably create a much more efficient algorithm if I were to code this as a proper plugin tool for Whitebox (perhaps I'll do that for the next release), but this will work for now. You simply need open Whitebox, open the Whitebox Scripter (press the scroll icon on the toolbar), paste the following code in, make sure that Python is selected as the language, save it, and run it. It should create a shapefile with the saddle points. It also creates a raster of the saddle points if you'd prefer that (just make sure that it doesn't delete it afterwards). It creates a bunch of temporary files that are deleted at the end. This is something else that I could improve if/when I write this as a proper tool in Whitebox. The nice thing about this approach is that it bases the saddle points on the geometry of the valley bottom and ridge line networks, rather than the elevations in a local 3 x 3 neighbourhood like you have with curvature based methods. This will be far more robust against elevation error. The valley bottom network is created by thresholding a D8 contributing area image ([valleys] = [contributing area] > thresholdValue1) and the ridge network is created by thresholding the branch length image ([ridges] = [branch length] > thresholdValue2).

# Get the working directory
wd = pluginHost.getWorkingDirectory()

# Input file names
streamsFile = wd + "tmp3.dep"
pointerFile = wd + "d8 pointer.dep"
ridgeNetworkFile = wd + "bmax network.dep"
demFile = wd + "Vermont DEM.dep"

# Find the channel heads
streamClass = wd + "temp1.dep"
args = [streamsFile, pointerFile, streamClass]
pluginHost.runPlugin("StreamLinkClassification", args, False, True)

channelHeads = wd + "temp2.dep"
args = [streamClass, "3", channelHeads]
pluginHost.runPlugin("EqualTo", args, False, True)

# Give each channel head a unique identifier
channelHeadsID = wd + "temp3.dep"
args = [channelHeads, channelHeadsID, 'false', 'true']
pluginHost.runPlugin("Clump", args, False, True)

# Extract the watersheds for the channel heads
watershedFile = wd + "temp4.dep"
args = [pointerFile, channelHeadsID, watershedFile]
pluginHost.runPlugin("Watershed", args, False, True)

# Find the minimum elevation ridge cell in each watershed
ridgeWatersheds = wd + "temp5.dep"
args = [watershedFile, ridgeNetworkFile, ridgeWatersheds]
pluginHost.runPlugin("Multiply", args, False, True)

minElev = wd + "temp6.dep"
args = [demFile, ridgeWatersheds, minElev, "minimum", "false"]
pluginHost.runPlugin("ExtractStatistics", args, False, True)

saddlePoints = wd + "saddle points.dep"
args = [minElev, demFile, saddlePoints]
pluginHost.runPlugin("EqualTo", args, False, True)

args = [saddlePoints, wd + "saddle points.shp"]
pluginHost.runPlugin("RasterToVectorPoints", args, False)

# Clean up
inputFiles = streamClass + ";" + channelHeads + ";" + channelHeadsID + ";" + watershedFile + ";" + ridgeWatersheds + ";" + minElev
args = [inputFiles]
pluginHost.runPlugin("DeleteFiles", args, False, True)
print "Operation complete!"
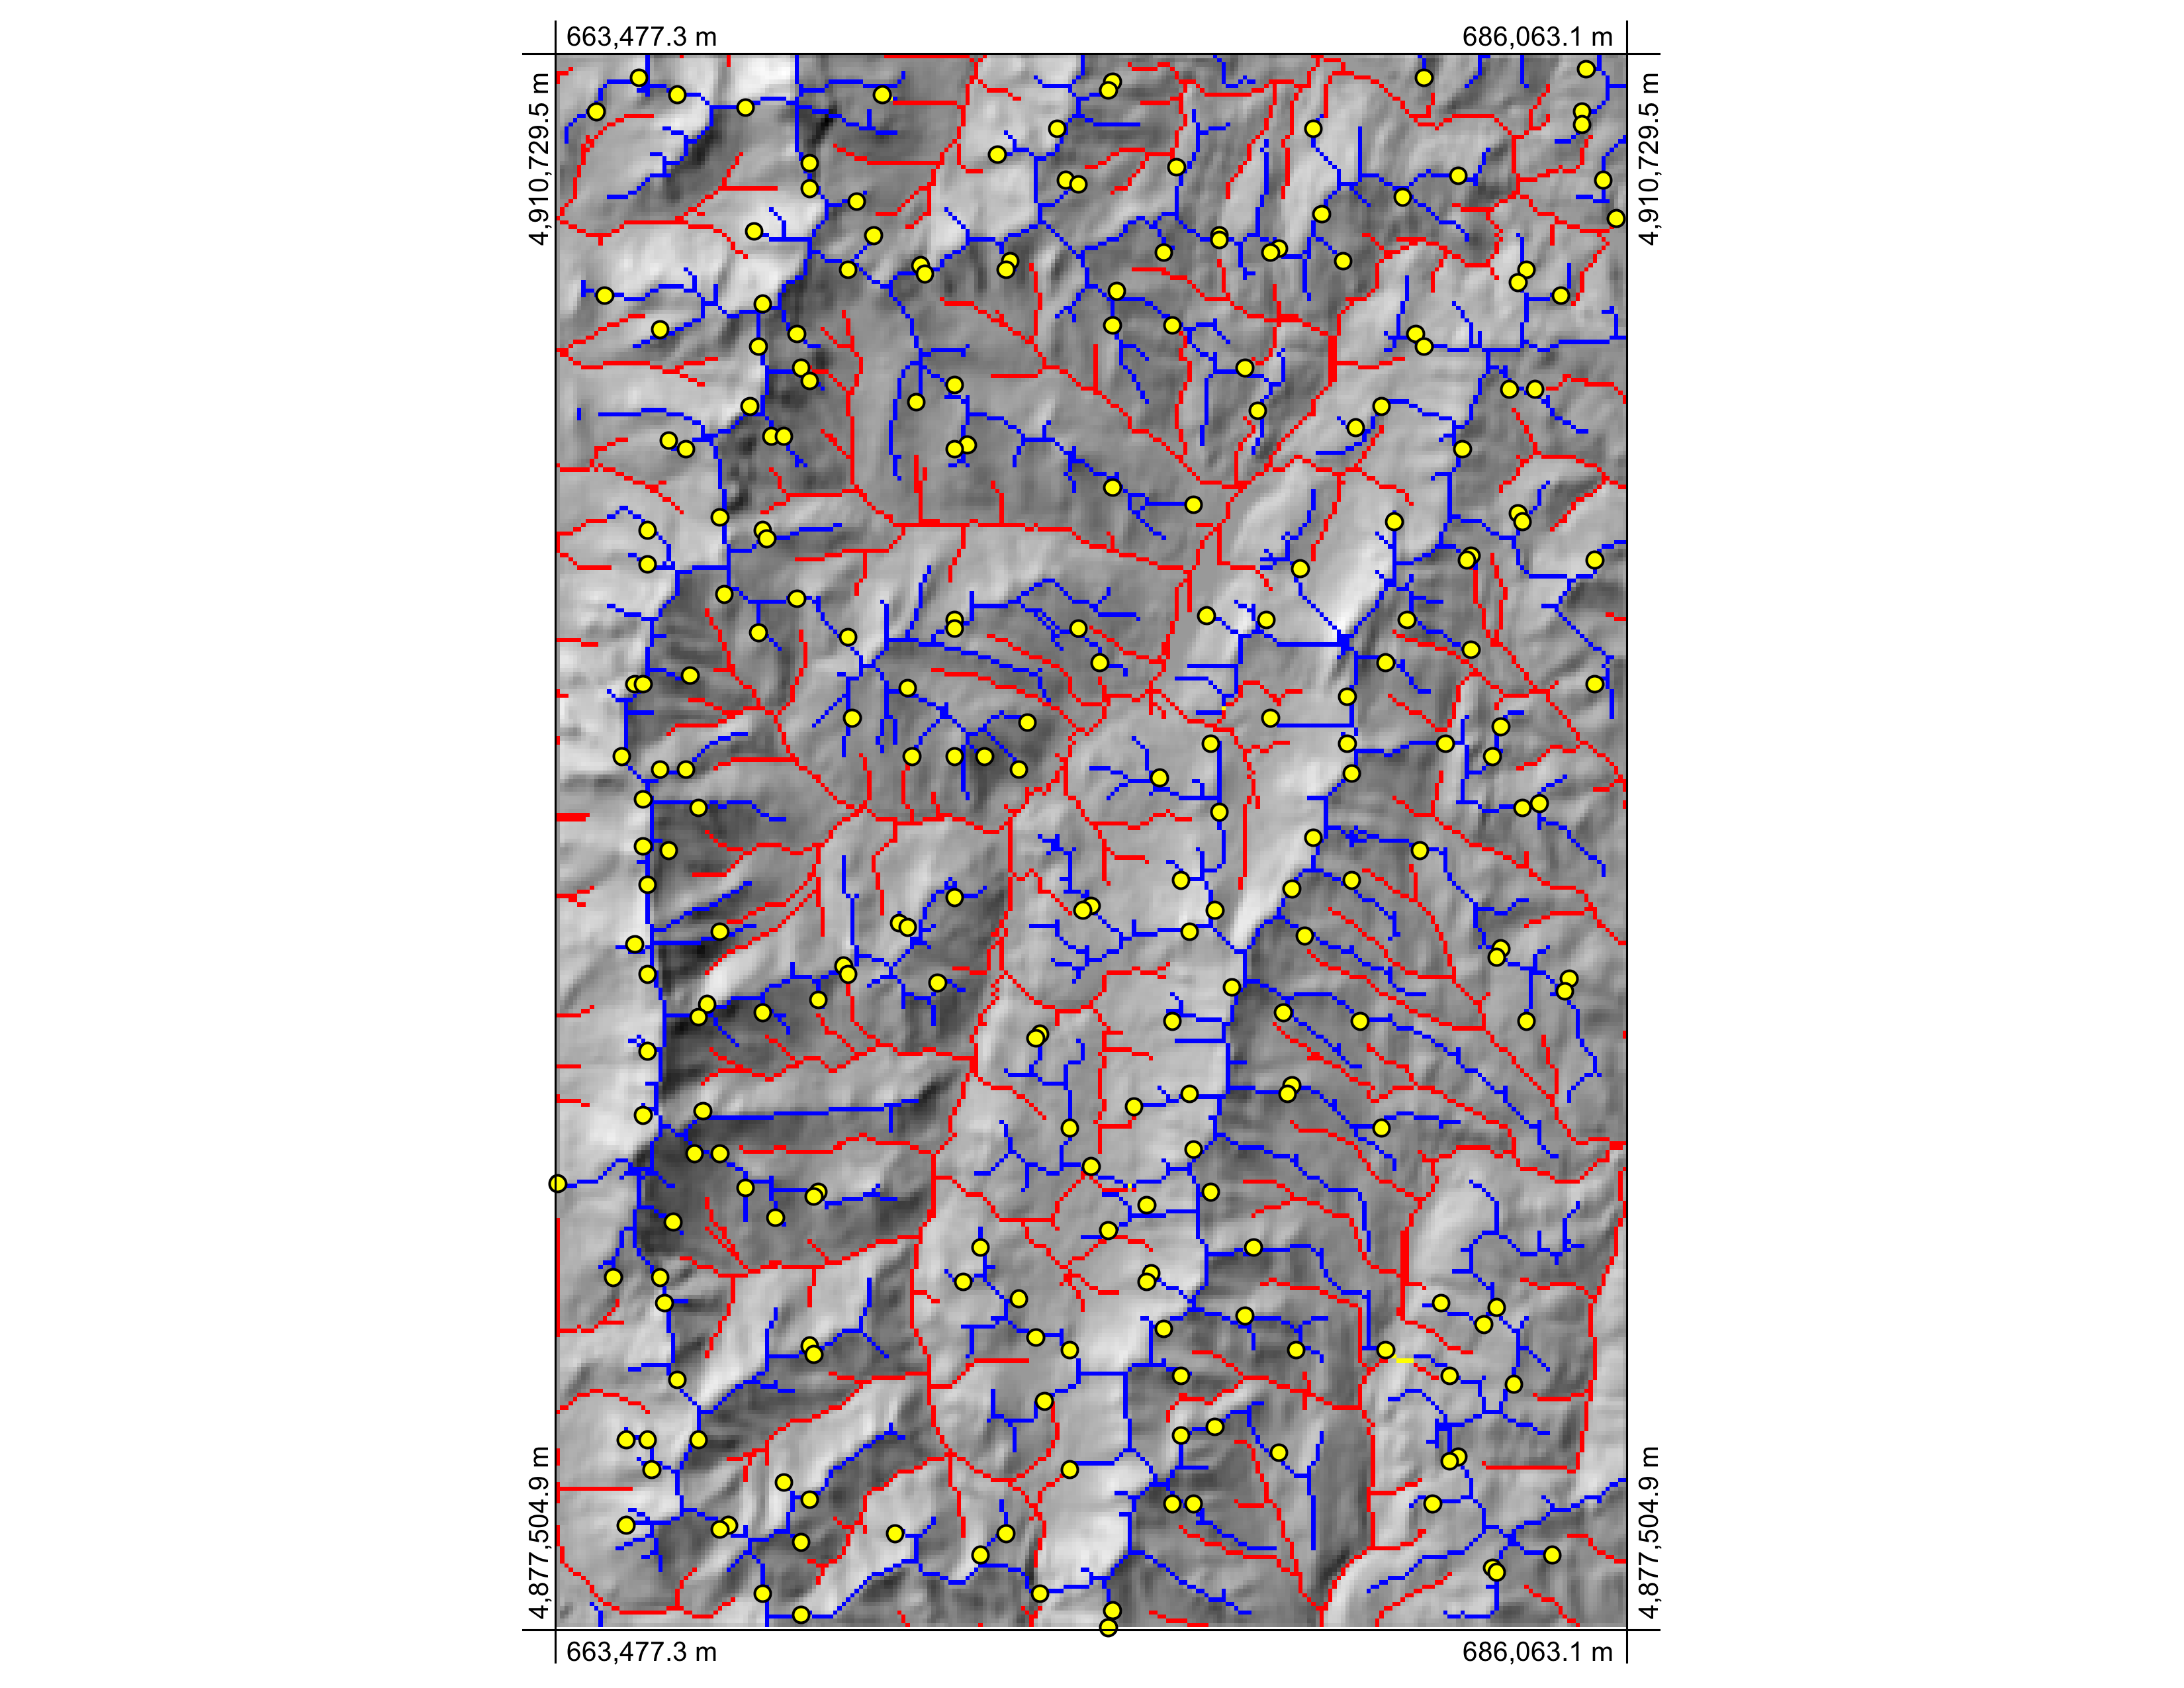
enter image description here

4
  • Thank you for the detailed response. It sounds promising. Could you elaborate on finding network intersections?
    – Barbarossa
    Commented Sep 18, 2013 at 19:29
  • Well there's two approaches. First, you could simply lower the threshold for defining valley bottoms from the contributing area image until the network intersects the ridge line network. This will likely be unsatisfactory because of the extensive 'feathering' of headwater channels that would occur. The second approach would be to come up with a way of identifying the lowest grid cell from the branch-length defined ridge network that drains into each channel head cell in the valley network line. If you're interested, I can write a Whitebox script to do this and upload it to my answer.
    – user21951
    Commented Sep 18, 2013 at 20:41
  • I suppose that I should have pointed out above that the lowest grid cells from the branch length network that drains into a channel head from the contributing area network IS a saddle point. This method would be more robust in the presence of elevation error than a curvature based method.
    – user21951
    Commented Sep 18, 2013 at 20:49
  • 1
    I've just finished coding a new plugin tool for Whitebox GAT that finds saddle points (i.e. passes) based on locating the lowest ridge cells draining to each valley head cell. It'll be available in the next public release (v. 3.0.5).
    – user21951
    Commented Sep 19, 2013 at 22:16
0

Apparently on a Windows system \r\n must be used, instead of \n on a Linux system. Worked for me.

See How can I force Python's file.write() to use the same newline format in Windows as in Linux (“\r\n” vs. “\n”)? at Stack Overflow for (slightly) more details.

0

You do not need to write an ASCII file to define a custom kernel. Using arcpy.sa.NbrWeight you can pass a vector of weight values and encode what would be newlines in the file as semicolons. You do still need the first position (2 values) in the vector to be the kernel dimensions, same as in the ASCII file.

FocalStatistics(r, arcpy.sa.NbrWeight("3 3; 1 0 0; 0 0 0; 0 0 1"), "SUM")

Your Answer

By clicking “Post Your Answer”, you agree to our terms of service and acknowledge you have read our privacy policy.

Not the answer you're looking for? Browse other questions tagged or ask your own question.