6

Having two raster maps as the examples below:
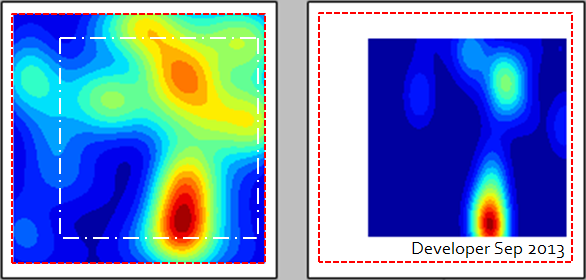
enter image description here

We are interested in evaluating their similarities. As shown, they are not fully overlapping. We guess one way is to clip small one area from the bigger one, therefore there will be two same size raster maps, e.g., arrays. So we may use pixel-wise correlation to find out how similar they are.

The existing issues/difficulties are:
1) The resolution of the two raster maps are not the same. So even for the above idea there is a problem of point-wise proceeding.

We wonder to know:

1) a better way to find their similarities as human-eye (+brain) does, that is, there is absolutely high similarity in the trend of spatial variation in the two maps.
2) if pixel-wise correlation is OK for our purpose?

EDIT
Think this way: image one as a matrix of size mxn and image two as a matrix of size pxq. A bounding box for matrix one is {x1,y1,x2,y2} which mean regardless to image one resolution its dual matrix (one) must fit the bounding box perfectly. The same scenario for image two and so matrix two. Note that their bounding boxes are also different. Thus this first stage is to stretch matrices to fit their dual bounding boxes. How to do this job while not using any image manipulation software? We prefer to do it using Python + Numpy (Scipy). The second stage is to resample each stretched matrix to a unique dimensions. This makes it possible to do element-wise operations on both matrices. How to do this? We are mostly concerned in the algorithms. You may notice that since the final comparison will be element-wise thus both the above stages must be properly chosen to avoid any distortion (change in the data). We are looking for some algorithms to handle all the above to result something that visually we see in terms of relationships in the two images (matrices).

5
  • 1
    Try eCognition!
    – Sandhya
    Commented Sep 20, 2013 at 10:16
  • 2
    I would try using the root mean squared error - I find it visually appealing, and intuitivly makes sense. This shows the steps. In this case you wouldn't sum them.
    – Sarah
    Commented Sep 20, 2013 at 12:40
  • How to compare the rasters depends on the purpose. Usually there's nothing the matter with resampling the coarser image to the finer resolution; use cubic convolution to maintain (approximately) its statistical properties. But then there are many ways to make the comparison: see my comment (to what may be a duplicate of this question) at gis.stackexchange.com/questions/71595/…. For example, you can apply L^p norms, correlation, and whatever to the rasters or to thresholded or transformed versions thereof.
    – whuber
    Commented Sep 20, 2013 at 17:24
  • @whuber as always your comment is informative: cubic convolution, L^P norms are good ideas to try.
    – Developer
    Commented Sep 24, 2013 at 11:28
  • We are approaching a solution as follows: (1) Find intersection area of the two matrices based on their bounding boxes. (2) Resize the matrices into a finer but unique shape. When they became same shape, the next is to compare them for any correlation. Well, still there are difficulties to implement but work is in progress ;)
    – Developer
    Commented Sep 29, 2013 at 5:19

3 Answers 3

6

You can solve this using R. The below code produces a scatter plot with linear regression and a Pearson correlation value. Because you're solving in R you have access to a massive range of statistical tools.

install.packages(raster)
library(raster)

# read rasters
r1 = raster("/dir/dir/file1.tif")
r2 = raster("/dir/dir/file2.tif")
# Resample r2 to r1
r2.samp = round(resample(r2, r1, "bilinear"))

# plot results
# Points
plot(getValues(r2.samp) ~ getValues(r1))
# Linear regression
abline(lm(getValues(r2.samp) ~ getValues(r1)))
# (Pearson) Correlation
legend("topleft", legend=paste("Correlation =", round(cor(getValues(r1),
getValues(r2.samp), use="complete.obs"), 2)))
2
  • What is r2.5k in your code? Shouldn't it be r2.samp instead? @MikeRSpencer
    – Iris
    Commented Oct 13, 2015 at 10:07
  • Good point, yes. Commented Oct 13, 2015 at 10:34
5

This is a fairly common problem so probably of great interest to many people. I can tell you how I would go about solving it using Whitebox GAT (http://code.google.com/p/whitebox-geospatial-analysis-tools/downloads/list) although I'm sure that there would be an equivalent workflow in either QGIS or Arc*.

  1. Use the 'New Raster From Base' tool to create a new blank raster the same dimensions (rows and columns) and extent as the smaller of the two grids.

  2. Use the 'Resample' tool to resample the data from the larger of the two grids into your newly created grid. You can use nearest neighbour, bilinear interpolation or cubic convolution as the resampling method. I'd probably recommend bilinear interp for your grid.

  3. Use either the 'Image Correlation' or perhaps the 'Image Regression' tool to discern the relation (and strength of association) between the two grids. This is fairly commonly used in the field of remote sensing to determine the amount of redundancy among various bands of multispectral imagery. There is also a tool in Whitebox called 'Compare Images for Significant Differences' which performs a paired sample t-test on the two grids. It can also be set up to take a random sample from the images in order to get around the problem that statistically significant differences can often be found even when there is no meaningful or substantive difference when the sample size is very large (as is often the case when you're dealing with images).

9
  • Although we are looking for algorithms rather an application, however, we downloaded Whitebox which is *.jar application (Java) to try. It didn't run at all!
    – Developer
    Commented Sep 24, 2013 at 11:25
  • It's hard for me to help you configure it to run without further details about your system. For example, which OS are you using and which version of Java do you have installed? You can send me an email and I'll see about helping you. Also, I was trying to give you directions to the algorithms. If you look at the dialogs for each of the specified tools, you will find a button called View Code it'll show the exact algorithms that I implemented.
    – user21951
    Commented Sep 24, 2013 at 11:48
  • We appreciated your help with an upvote, John. We will, as your suggestion. For now OS is Windows XP or 7 with latest (7) Java installed. When we try to run whitebox the cursor shows busy for a while but nothing happens.
    – Developer
    Commented Sep 25, 2013 at 8:52
  • Okay, are you sure that you're double clicking the unzipped version of the jar? That's a common problem on Windows (at least with my students ;) Also, do you have an open internet connection? The program searches to see if there is a more recent version when it first launches. Are you running the latest version, 3.0.5? Also, if you're just after the algorithm you can also see the source code here: code.google.com/p/whitebox-geospatial-analysis-tools/source/…
    – user21951
    Commented Sep 25, 2013 at 13:08
  • They were OK as there are other jar applications that just work fine. We solved the issue by uninstalling all Java versions and installing a fresh 7. Now WhiteBox works fine.
    – Developer
    Commented Sep 26, 2013 at 1:12
0

I would suggest clipping the same AOI and use ImageMagick which is opensource using maybe a fuzz tolerance.

1
  • We added an EDIT to emphasis our goal.
    – Developer
    Commented Sep 22, 2013 at 5:32

Your Answer

By clicking “Post Your Answer”, you agree to our terms of service and acknowledge you have read our privacy policy.

Not the answer you're looking for? Browse other questions tagged or ask your own question.