3

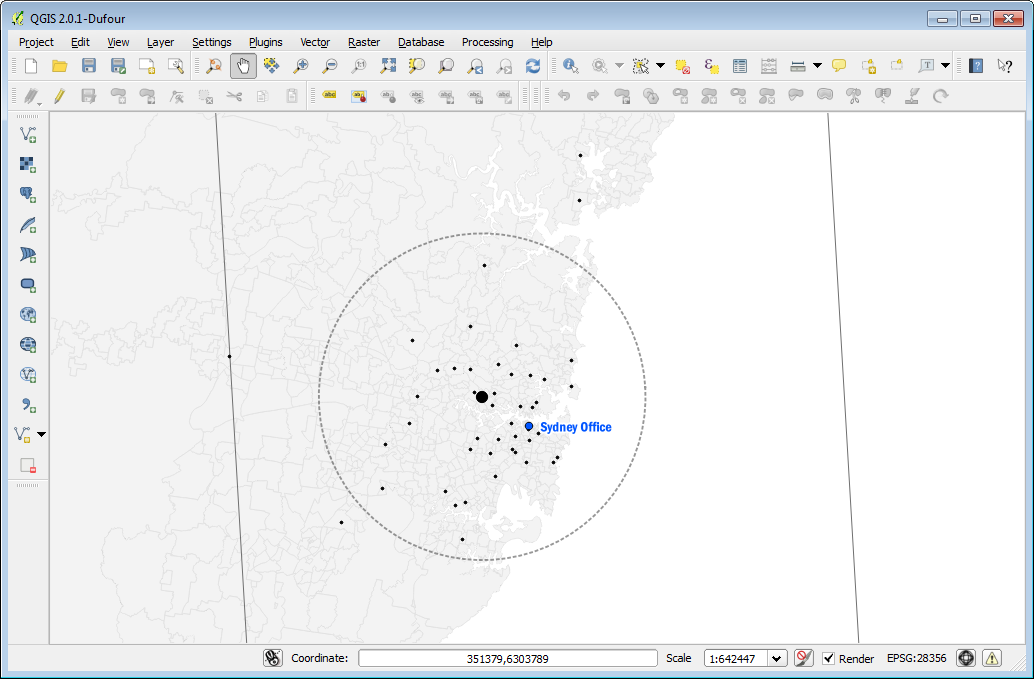
I have a cluster of points and I am using the Spatial point pattern analysis tool from the processing toolbox in QGIS 2. I am having trouble understanding what the "Standard Distance" output is?

It looks to me like it represents two standard deviations from the mean as it covers about 84% of my data, but this is only a guess. I clicked on the help tab of the tool but there were no details there.

Any one know exactly what the "Standard Distance" layer (dotted circle) is showing?

enter image description here

Thanks

Ando

0

1 Answer 1

3

I assume you are referring to the SAGA tool. SAGA documentation can be hard to come by.

So I went to the SAGA SVN and found the following code:

StdDist = 0.0;

for(iPoint=0; iPoint<pPoints->Get_Count() && Set_Progress(iPoint, pPoints->Get_Count()); iPoint++)
{
    TSG_Point   p   = pPoints->Get_Shape(iPoint)->Get_Point(0);

    D.Add_Value(SG_Get_Distance(X.Get_Mean(), Y.Get_Mean(), p.x, p.y));

    StdDist += SG_Get_Square(p.x - X.Get_Mean()) + SG_Get_Square(p.y - Y.Get_Mean());
}

StdDist = sqrt(StdDist / D.Get_Count());

Code interpretation from @whuber's comment:

The code computes the root mean squared distance to the centroid. When the points have an isotropic Gaussian ("Normal") distribution and there is more than a handful of them, their distances follow a chi distribution. Therefore, expect about 63% of them to lie within the standard distance of their centroid. 95% of them should lie within 1.73 standard distances of the centroid. This is a very crude reference: after all, many point datasets exhibit strikingly non-Gaussian characteristics.
5
  • 1
    It would help to have a clearer--preferably quantitative--description of the standard distance. What is its formula? (There are several conventions and they vary.) Roughly what fraction of the dataset is it expected to cover?
    – whuber
    Commented Oct 22, 2013 at 21:50
  • So all this layer is showing is a value/radius demonstrating how concentrated or dispersed the data is? Is this value the average distance of a site from the distributions mean? I'm not sure I get how to make sense of that value! I was hoping to get something showing me that 95% of the population is within this radius - maybe I am using the wrong tool.
    – Ando
    Commented Oct 22, 2013 at 23:15
  • @whuber I dug up the code. I think it is the formula SS_Rebelious posted but with the square root containing 1/n as well.
    – underdark
    Commented Oct 23, 2013 at 16:33
  • 2
    +1. The code computes the root mean squared distance to the centroid. When the points have an isotropic Gaussian ("Normal") distribution and there is more than a handful of them, their distances follow a chi distribution. Therefore, expect about 63% of them to lie within the standard distance of their centroid. 95% of them should lie within 1.73 standard distances of the centroid. This is a very crude reference: after all, many point datasets exhibit strikingly non-Gaussian characteristics.
    – whuber
    Commented Oct 23, 2013 at 16:39
  • @whuber Hope you don't mind that I added your code interpretation to the answer.
    – underdark
    Commented Oct 23, 2013 at 16:54

Your Answer

By clicking “Post Your Answer”, you agree to our terms of service and acknowledge you have read our privacy policy.

Not the answer you're looking for? Browse other questions tagged or ask your own question.