10

This question builds off of the one with the subject line "Calculating Flow Direction and Delineating Basins from Projected vs. Unprojected Data.": Calculating Flow Direction and Delineating Basins from Projected vs. Unprojected DEM Data

This is an entirely separate question, however, as the aforementioned question has established that there are problems with using algorithms (e.g., ArcGIS Flow Direction) that assume Euclidean distance on data in a spherical/unprpojected geographic coordinate system.

We know that map projections are sort of like taking an orange peel and attempting to flatten it out on a desk - you will have some error inherently introduced by the map projection. But, it seems that the benefits of projecting offset any error introduced, particularly when you're running calculations that assume a Cartesian/projected planar surface. In this case, the algorithm I'm interested in is the ArcGIS Flow Direction algorithm which does assume that your data are projected (and this is the assumption taken by most applications based on my research) as it uses a Euclidean approach for calculating distance.

My question is: how could one quantify the error that might be introduced with calculating flow direction in a given study area using unprojected DEM data (DEM data in a geographic coordinate system) vs. projected data (DEM data in an appropriate projection such as a UTM or something conformal)?

Granted, you can derive a flow direction raster using unprojected and then the same DEM data projected. But what then? Since our goal is to model the earth's surface as accurately as we can (and we're not addressing any errors that may be introduced in the process of creating the original DEM etc. - those are a constant as far as I'm concerned)....do we just assume the flow direction data derived from the projected DEM is better, and then compare the individual cell values of the two rasters to identify which cells have different directional values (in the context of the normal D-8 model)? I guess to do this then you'd have to take the flow direction raster derived from unprojected data, and then apply the same projection used with the projected flow direction raster.

What would make the most sense, and what should the unprojected DEM be compared to as a benchmark of accuracy?

Getting into the nitty details of the mathematical equations might, to those that understand it, give you proof at the ground level and be enough for some, but that as well as something that could convey the error to someone that does not have an in-depth understanding of the math but may just know enough geography/GIS to be dangerous would be great (ideally both levels would be good which would resonate with the hardcore geography geeks and the average GIS dabbler). For the higher level folks, saying that the proof is in the math possibly leaves it somewhat open for argument - I'm looking for something more tangible (e.g., akin to attaching a dollar figure to some sort of inefficiency in government).

Any thoughts or ideas on how one might quantify this would be greatly appreciated.

Tom

5
  • 1
    I think this is an interesting question, but in the context of hydrological modeling it seems that limiting your inquiry into errors in the difference between projected and unprojected space is over-restrictive: the errors introduced by the selection of the D8 algorithm are likely to exceed that of projection. Are you interested in accuracy from a high level, or do you have a specific reason for restricting it to projected vs. unprojected?
    – scw
    Commented Apr 4, 2011 at 19:27
  • 1
    @scw Good comment. Note, however, that the failure-to-project error begins exceeding the maximum d8 error (at least for some flow directions) at latitudes higher than 40 degrees or so and typically is of comparable size (as a change in the angle of flow). Thus, projection error and d8 error are equally deserving of attention. Furthermore, d8 error (sort of) averages out in all directions, but the projection error creates a systematic bias. Thus projection error is arguably worse--perhaps much worse--than d8 error at almost all latitudes.
    – whuber
    Commented Apr 6, 2011 at 21:47
  • 1
    Thanks for the comments - I understand what you're saying re: D8 and the issues with that, but the original impetus for this whole discussion (and the related previous post asking whether better to project or not project) was solely focused on that question: is it better to project your data, or does it not matter? That's why this question only focused on that aspect because it has practical implications for my team and the common tools we use to do our work.
    – MapBlast
    Commented Apr 11, 2011 at 17:43
  • Thank you for this and prior question. It's important to have theory/basic-principles discussions that are software agnostic as well as "how can I make program-x do y?". I just wish I were better capable of understanding their depth and details. ;-) Commented May 4, 2011 at 17:53
  • @matt wilkie- thanks for the comment and I agree...it's important to get under the hood with these types of things. GUI packages like ArcGIS with "default settings" on tools and blackbox tools make it all to easy to just click and run and not be concerned with the details. Hence, why it took me so long to get the detailed answer I needed on this topic. As professionals we need to understand what the HECK it is we're doing!
    – MapBlast
    Commented May 4, 2011 at 21:54

1 Answer 1

6

The analysis has already been done in a reply to the antecedent question, but perhaps an illustration will help.

There are two major components of error: the "d8" algorithm, which represents flows in only eight cardinal directions, and the effect of projection (or lack of it). Let's focus on the latter, because this seems to be the principal concern.

The error depends on the distortions in the projection and on the terrain itself. Locally, over a small region, all projection distortions on the earth's surface amount to a stretch in one direction compared a perpendicular direction: this is why a (properly computed) Tissot Indicatrix is a perfect ellipse, because an ellipse is just a stretched circle. The terrain can have any aspect (flow direction). To handle this, let's look at a terrain that indeed has points in all possible directions with simple flow lines: a cone.

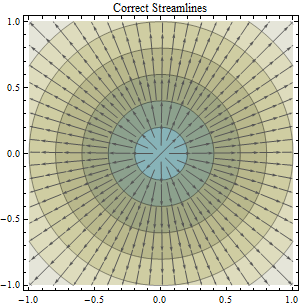
Cone 1

Overlaid on this color-shaded contour map of cone elevation is a collection of streamlines showing the directions where water would flow. You can confirm these streamlines are correct by checking that they cross the contours at right angles.

By choosing appropriate units of measurement and an appropriate origin for the coordinate system (at the cone's apex), the equation for the elevation in terms of coordinates (x,y) is simply

z = -Sqrt(x^2 + y^2).

The streamlines are always parallel to the gradient of z (in the reverse direction), computed by differentiating this formula with respect to x and y:

-Grad(z) = (x, y) / Sqrt(x^2 + y^2).

The coefficient 1/Sqrt(x^2 + y^2) doesn't change the direction, so we can ignore it for the purposes of understanding streamlines. Thus, at any location (x,y), the streamline points in the direction (x,y).

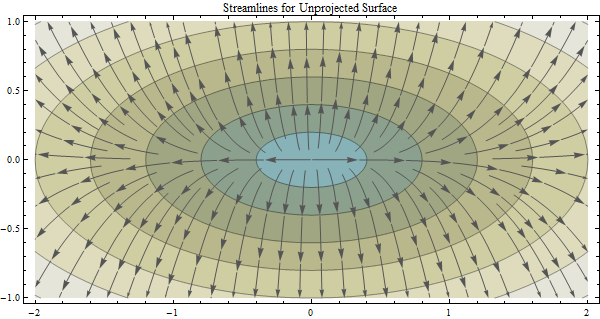
Cone 2

The effect of a horizontal stretch in the coordinates (by a factor of 2 in this image) is to stretch all contours (without changing the contour levels: heights are not affected by projections). Although (of course) the contours represent true circles, they no longer look like true circles on the map. Nevertheless, when the streamlines are computed in these coordinates, they must cross the contours at right angles just as before.

The effect of the stretch is to put the elevation at any point of coordinates (x,y) at new coordinates (stretchx, y). Consider this in reverse: the elevation at coordinates (X,Y) = (stretchx,y) must be the value of z computed at (x,y) = (X/stretch,Y). Therefore the equation of the apparent surface in this projection is

z = -Sqrt((x/stretch)^2 + y^2).

Differentiating, we compute

-Grad(z) = (x/stretch^2, y) / Sqrt((x/stretch)^2 + y^2).

Again the common factor matters not; thus, at any location (x,y), the computed streamline points in the direction (x/stretch^2,y). This was the formula used to draw the streamlines in the preceding picture. You can see they correctly cross the contours at right angles.

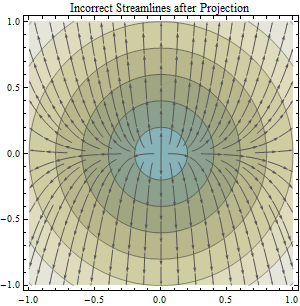
Cone 3

This third image reprojects the previous picture. The surface is shown once more without distortion. However, the streamlines no longer appear to cross the contours at right angles. This was the case even in the previous picture: due to the distortion therein, the angles only appeared to be right angles. The crossings were incorrect all along. That's why not projecting (or using a nonconformal projection) is a mistake. The question is how big a mistake it might be. Some have claimed it's of little consequence (at least at low to moderate latitudes).

This reprojection (to remove distortion in the map) moves the point at (x*stretch, y) back to (x,y). The stream direction previously computed at this point was stored in a grid (as an angle or a direction code): it does not change. Therefore the computed stream direction at (x,y) is (x/stretch^2, y).

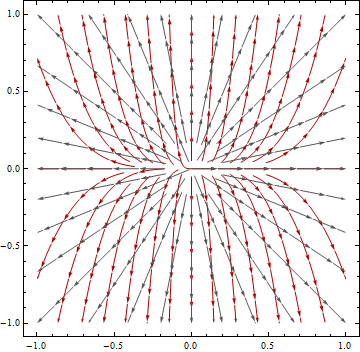
This quantifies the effect of a reprojection on all possible flow directions, as shown by the difference between the first and last graphic. Here's their overlay, without the contour plot for distraction:

Flow comparison overlay

Reprojection affects directions differently depending on how the flow is oriented with respect to the major axis of the Tissot Indicatrix. It is a quadratic function of the relative linear distortion in the projection. As such, it exaggerates even slight amounts of distortion. (The factor of two illustrated here is somewhat extreme but realistic: it is the distortion introduced by failing to project--that is, using geographic coordinates as map coordinates--at latitudes of 60 degrees.)

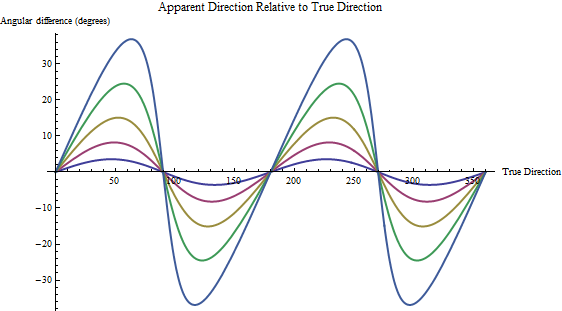
With a little bit of trigonometry one can use these results to compute the angular error in flow direction as a function of the correct direction. Here is a graph of the errors associated with using a geographic (unprojected) coordinate system at latitudes 20, 30, 40, 50, and 60 degrees. (Of course the larger errors are associated with higher latitudes.)

Angular error plot

The "true direction" is in degrees east of north. Positive angular differences occur when the apparent direction (computed without projecting lat, lon) is counterclockwise of the true direction.

Remember, you have to superimpose the d8 errors on top of these!

Your Answer

By clicking “Post Your Answer”, you agree to our terms of service and acknowledge you have read our privacy policy.

Not the answer you're looking for? Browse other questions tagged or ask your own question.