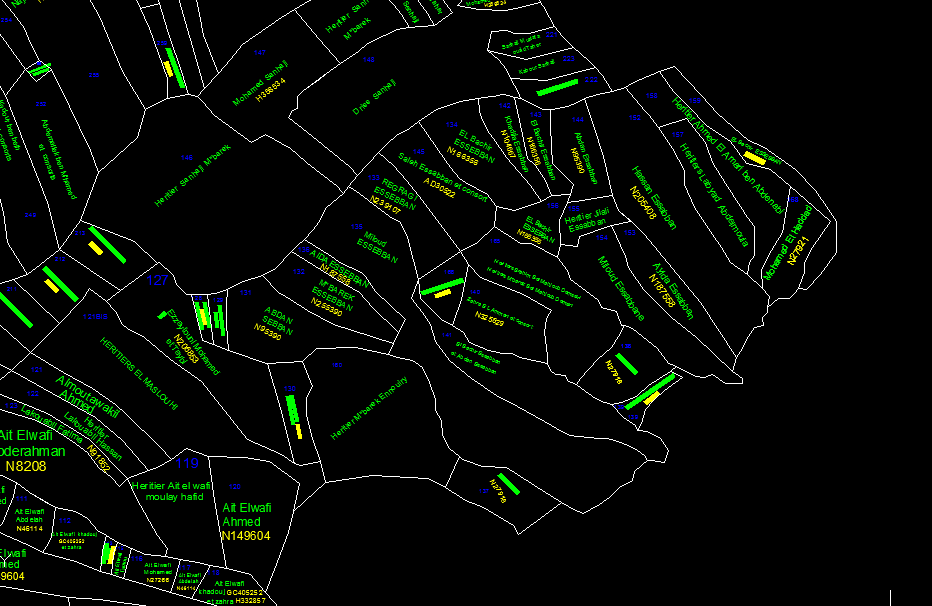
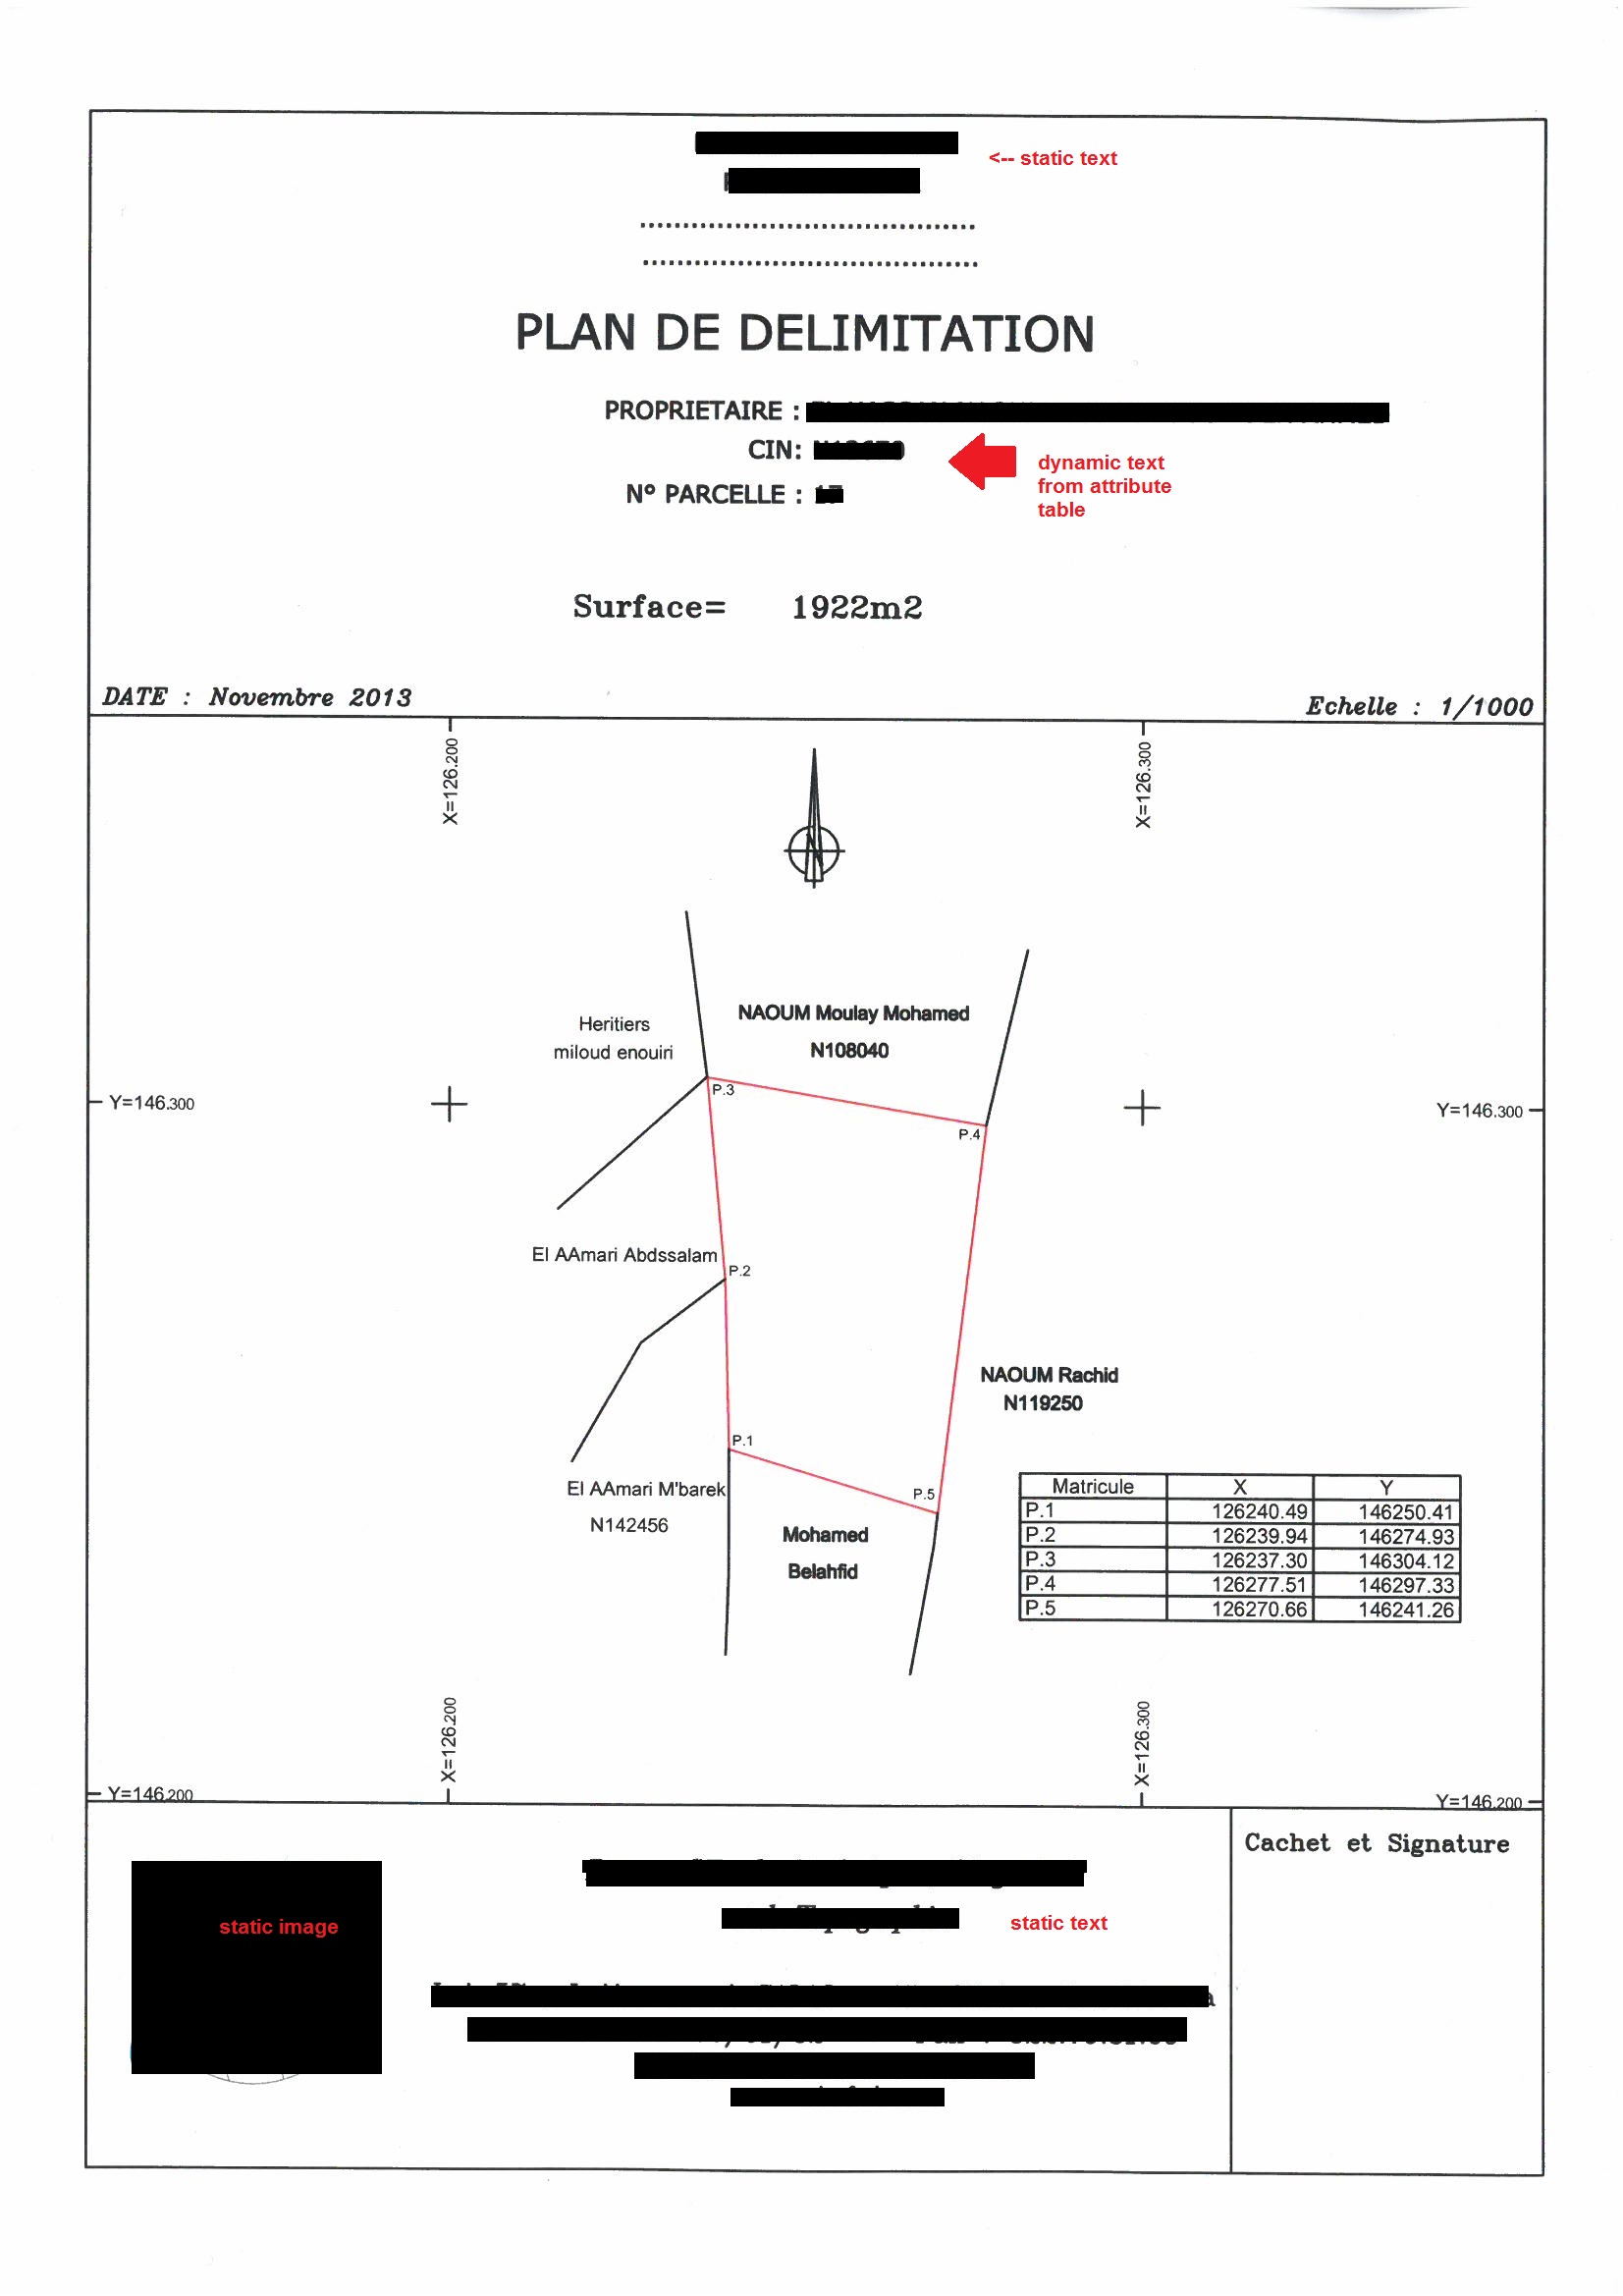
This is typically something you can do with Data Driven Pages.
The static text and images is not a problem, you can modify one lay out and this will be transmitted to all other layouts.
For the dynamic text, it can be driven based on one of the attribute fields using this syntax " domainlookup="true"/>
The most complicated part is what you show on the map. The data driven pages will zoom on each parcel (you can either set a fixed scale or an extend related to the parcel bounding box). You will need a script for showing only one parcel and the line around.
import arcpy
import arcpy.mapping as mmap

mxd = mmap.MapDocument("your.mxd")
DF = mmap.ListDataFrames(mxd)[0]
sourcely = mmap.Layer(the_source_of_your_lyr_file_on_disk) #lyr file create from your parcels feature class (with al the parcels)
i = 0
fc = yourparcels.shp
rows = arcpy.SearchCursor(fc)
for row in rows:
    sourcely.definitionQuery = '("FID" = ' + str(i) + ')' #select only one parcel
    sourcely.save()
    sourcely = mmap.Layer("mylayer.lyr")
    ly = mmap.ListLayers(mxd)[1]
    mmap.UpdateLayer(DF, ly, sourcely, False)
    i = i + 1
    mxd.dataDrivenPages.exportToPDF(path + row.getValue("name") + ".pdf", 'RANGE' , str(i), '400')
for the lines around the parcels, this gets even more complicated: you should prepare a set of lines for all your parcels (loop to create a buffer around each parcel then clip those), then create a layer that points on the appropriate lines in the above script example.
for the table, you could also build it with arcpy, like in the example below from ArcGIS help.
import arcpy
mxd = arcpy.mapping.MapDocument(r"C:\Project\Project.mxd")

#Reference items in the map document
lyr = arcpy.mapping.ListLayers(mxd, "Accidents")[0]
horzLine = arcpy.mapping.ListLayoutElements(mxd, "GRAPHIC_ELEMENT", "horzLine")[0]
vertLine = arcpy.mapping.ListLayoutElements(mxd, "GRAPHIC_ELEMENT", "vertLine")[0]
tableText = arcpy.mapping.ListLayoutElements(mxd, "TEXT_ELEMENT", "TableText")[0]

#Get/set information about the table
numRows = int(arcpy.GetCount_management(lyr).getOutput(0))
rowHeight = 0.2
fieldNames = ["X", "Y", "Accidents"]
numColumns = len(fieldNames)
colWidth = 1.5

#Build graphic table lines based on upper left coordinate
#  set the proper size of the original, parent line, then clone it and position appropriately
upperX = 1.0
upperY = 5.0

#Vertical lines
vertLine.elementPositionX = upperX
vertLine.elementPositionY = upperY
vertLine.elementHeight =  (rowHeight * numRows) + rowHeight #extra line for column names

x = upperX
for vert in range(1, numColumns+1):
  x = x + colWidth
  vert_clone = vertLine.clone("_clone")
  vert_clone.elementPositionX = x

#Horizontal lines
horzLine.elementPositionX = upperX
horzLine.elementPositionY = upperY
horzLine.elementWidth = numColumns * colWidth

y = upperY - rowHeight
for horz in range(1, numRows +2 ):  #need to accommodate the extra line for field names
  temp_horz = horzLine.clone("_clone")
  temp_horz.elementPositionY = y
  y = y - rowHeight

#Place text column names
tableText.elementPositionX = upperX + 0.05 #slight offset
tableText.elementPositionY = upperY
tableText.text = fieldNames[0]
accumWidth = colWidth
for field in range(1, numColumns):
  newFieldTxt = tableText.clone("_clone")
  newFieldTxt.text = fieldNames[field]
  newFieldTxt.elementPositionX = newFieldTxt.elementPositionX + accumWidth
  accumWidth = accumWidth + colWidth

#Create text elements based on values from the table
table = arcpy.SearchCursor(lyr.dataSource)
y = upperY - rowHeight
for row in table:
  x = upperX + 0.05 #slight offset
  try:
    for field in fieldNames:
      newCellTxt = tableText.clone("_clone")
      newCellTxt.text = row.getValue(field)
      newCellTxt.elementPositionX = x
      newCellTxt.elementPositionY = y
      accumWidth = accumWidth + colWidth
      x = x + colWidth
    y = y - rowHeight
  except:
    print"Invalid value assignment"

#Export to PDF and delete cloned elements
arcpy.mapping.ExportToPDF(mxd, r"C:\Temp\test.pdf")

for elm in arcpy.mapping.ListLayoutElements(mxd, wildcard="_clone"):
  elm.delete()
del mxd
this table is populated using a table view, which can be created by selecting the vertices of your polygon by location for each polygon (see "make feature layer" and "select layer by location" tools)


