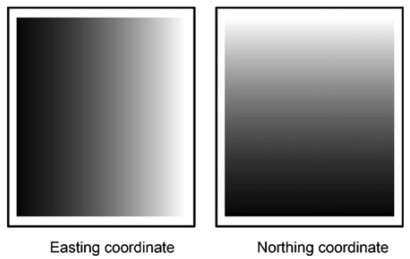
In a journal article I have read that two rasters, representing X and Y coordinates respectively (see attached figure), have been entered as predictors in a GIS-based Logistic Regression for a given reason (namely, in order to reduce possible auto-correlation issues). I was wondering how such rasters can be produced in ArcGIS (10.1). The reference is: Hu, Z., & Lo, C. P. (2007). Modeling urban growth in Atlanta using logistic regression. Computers, Environment and Urban Systems, 31, 667–688. http://doi.org/10.1016/j.compenvurbsys.2006.11.001

