"Calculations based on either Euclidean or Manhattan distance require projected data to accurately measure distances." therefore it does not work with longitude latitude (or using a package like circular (Circular Statistics))
With projected data
x = c(203595.92857397342, 203711.9297397244, 203992.57772137996, 203756.83341678928, 203610.89646632838, 203393.86202718143, 203524.83108528735, 203696.96184736944, 203363.9262424715, 203887.8024748952, 204018.77153300116, 204131.03072566338, 204426.6465996739)
y = c(89463.34428931243, 89343.60115047272, 89246.30985016546, 89152.76052294695, 89253.79379634294, 89343.60115047272, 89122.82473823702, 88991.85568013109, 89609.28123977332, 89687.86267463688, 89556.89361653096, 89901.15514069512, 89833.79962509777)
mean_centerX <- mean(x)
mean_centery <- mean(y)
standard_deviationX = sd(x)
standard_deviationY = sd(y)
standard_distance <- sqrt(sum(((x -mean_centerX)^2(y-mean_centerY)^2))/(length(x)))
library(plotrix)
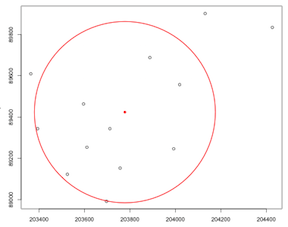
plot(x,y)
points(mean_centerX,mean_centery,col="red",pch=16)
draw.circle(mean_centerX,mean_centery,radius=standard_distance,border="red",lwd=2)

