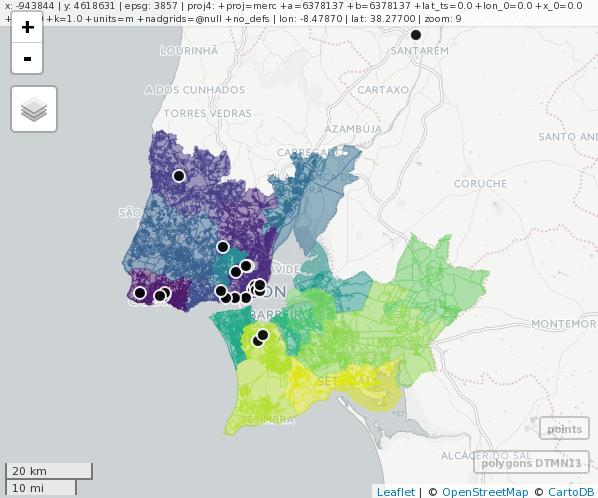
Try the commented and reproducible example below!
I use the 'sf' package because is much faster than 'rgdal' to open ShapeFiles. Also, I used the great package mapview for interactive visualization in R. I transformed the points object to polygon's default projection before doing the intersection.
# Load libraries ----------------------------------------------------------

library('sf')
library('mapview')

# Download data -----------------------------------------------------------

# Download polygon
download.file("http://mapas.ine.pt/download/files/2011/nuts2/lisboa2011.zip", destfile = "lisboa2011.zip")
unzip("lisboa2011.zip")

# Load data ---------------------------------------------------------------

polygons <- sf::read_sf("BGRI11_LISBOA.shp")
points <- read.csv(file = "Points.csv", sep = ";")

# Convert points df to sf object
points <- st_as_sf(points, coords = c("lon", "lat"))
st_crs(points) <- "+init=epsg:4326 +proj=longlat +ellps=WGS84 +datum=WGS84 +no_defs +towgs84=0,0,0" # assign CRS to points

# Plot data
mapview::mapview(polygons, zcol = "DTMN11") + mapview::mapview(points, color = "white", col.regions = "black")
# Overlay Population with BGRI subsections --------------------------------

# Transform points data
pointsT <- st_transform(points, crs = st_crs(polygons))
print(st_crs(pointsT))

# Plot transformed data to check is ok
mapview::mapview(polygons, zcol = "DTMN11") + mapview::mapview(pointsT, color = "white", col.regions = "black")

# Intersection
overlayOutput <- st_intersects(pointsT, polygons)

# Build intersected polygons object
intersectedPolys <- polygons[unlist(overlayOutput), ]

mapview::mapview(polygons, zcol = "DTMN11") + mapview::mapview(pointsT, color = "white", col.regions = "black") + mapview::mapview(intersectedPolys, color = "black", col.regions = "black")
Note: the intersected polygons are colored in "black".


