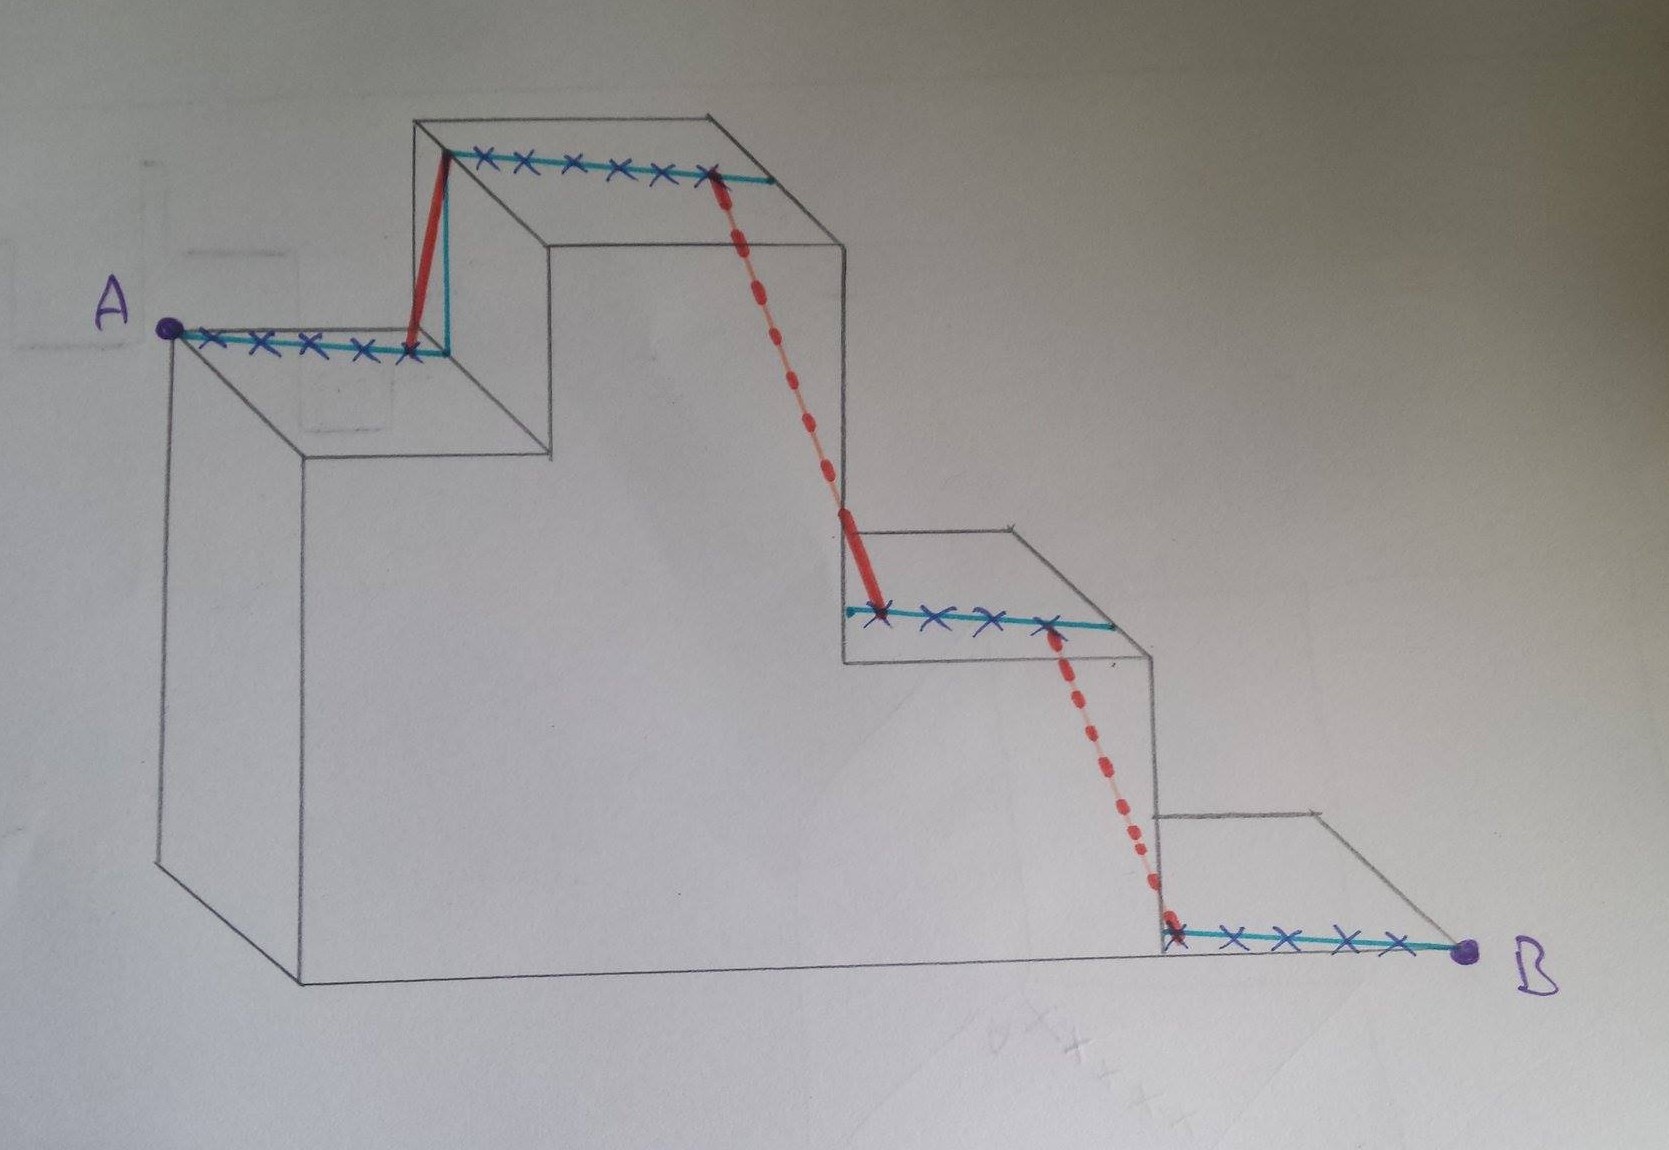
Thank you very much for your help
Possible solution: (takes a long time to compute)
library(raster)
library(sp)

# create elevation raster
e <- as(extent(-1942755,-1847241,2524840,2624901), "SpatialPolygons")
proj4string(e) <- "+proj=aea +lat_1=29.5 +lat_2=45.5 +lat_0=23 +lon_0=-96 +x_0=0 +y_0=0 +datum=NAD83 +units=m +no_defs +ellps=GRS80 +towgs84=0,0,0"

r <- raster(e, res=1000)
r[] <- runif(ncell(r),500,2500)

# plot raster
x11()
plot(r)

# creat coordinates
xy <- data.frame(x= c(-1859255, -1876255), y=c(2586401, 2552401))

# add coordinates to plot
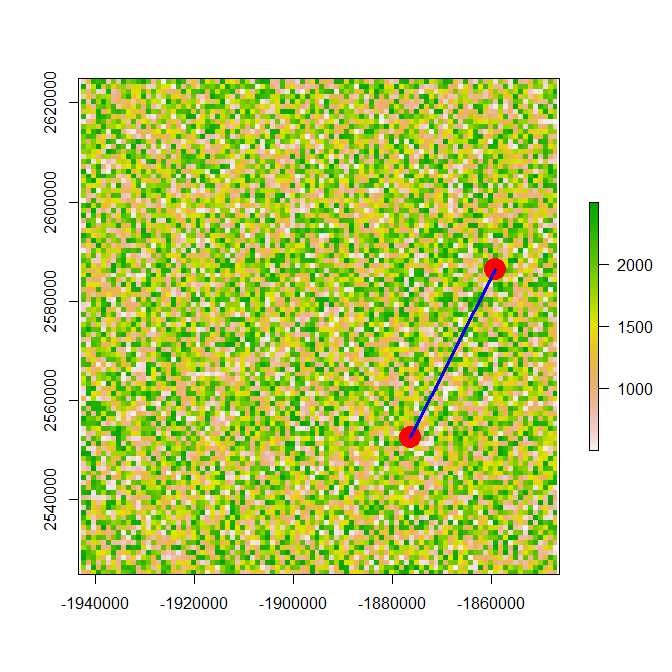
points(-1859255, 2586401, col="red", cex=3, pch= 19)
points(-1876255, 2552401, col="red", cex=3, pch= 19)

#creat spatial line
l <- SpatialLines(list(Lines(list(Line(xy)),ID="1")))

#add spatial line to plot
plot(l, add=TRUE, lwd=3, col="Blue")

#create points along line
library(rgeos)
library(sp)
numOfPoints  <-  gLength(l)*10 #segments of 10cm if l in meters
points<-spsample(l, n = numOfPoints, type = "regular")

#add points to plot
plot(points, add=TRUE)


#get elevation for each points
points.df<-as.data.frame(points)
points.df$elevation<-raster::extract(r, points.df)

#comput distance between each points

head(points.df)
output<-data.frame(length=1:length(points.df$x))
i.2<-(length(points.df$x)-1) #last point has no further point for a distance
for(i in 1:i.2){

x1<-points.df[i,"x"]
x2<-points.df[i+1,"x"]
y1<-points.df[i,"y"]
y2<-points.df[i+1,"y"]
z1<-points.df[i,"elevation"]
z2<-points.df[i+1,"elevation"]


Distance<-((x1-x2)^2+(y1-y2)^2+(z1-z2)^2)^0.5

output[i,]<-Distance
}
output[length(points.df$x),]<-0 #last point has no further point for a distance

sum(output) # Length between A and B
This method allows for the calculation of the distance between two coordinates (A,B) considering an elevation raster. The "line" is fragmented into segments delimited by sub-coordinates (points) plotted at an equal distance on the line. The line is thus linking points A and B by following the raster layer surface. When two sub-coordinates are in the same cell, the distance is the horizontal distance (blue). When the two coordinates are in differents cells, the distance is the hypotenuse length (red). 

