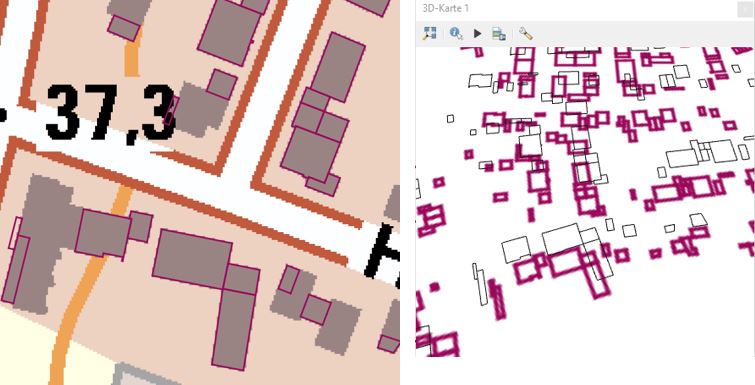
I`d like to find out if and how it is possible to visualize LoD2 data (source:https://www.opengeodata.nrw.de/produkte/geobasis/3d-gm/) in QGIS 3.4/Madeira.
So far I managed to load them into the project, but unlike other examples and tutorials I´ve seen, they come as lines instead of polygons. After enabling 3D for the layer and opening the 3D-View, it only "kind-of" worked with a second set of lines flying above the footprints - see screenshot (3D-View without background-map for a clearer image). So - unless there are issues with the data - I suppose I missed something...

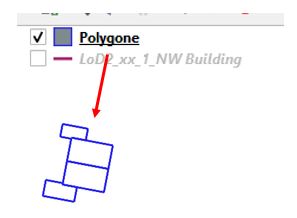
I also tried to convert them into polygons - first as original data and then after saving them as Esri-shapes, but the result was always that even the "polygons" came as "lines":
Does anybody know if these data can be visualized with QGIS and if/how I have to prepare them or which steps in QGIS are necessary? Thank You
