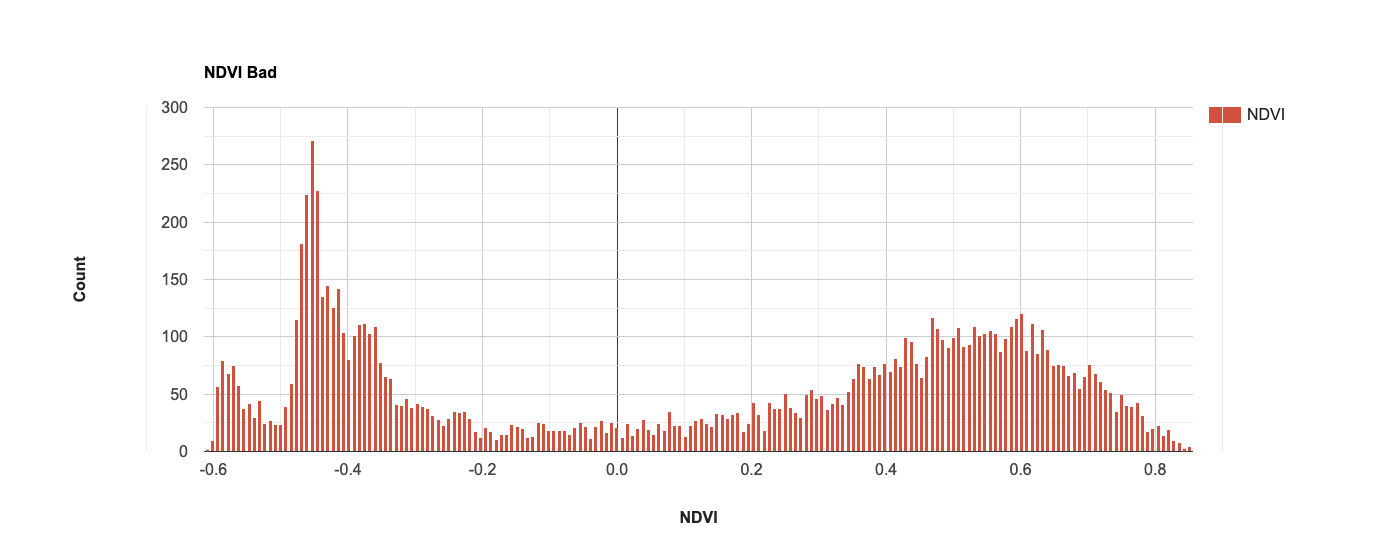
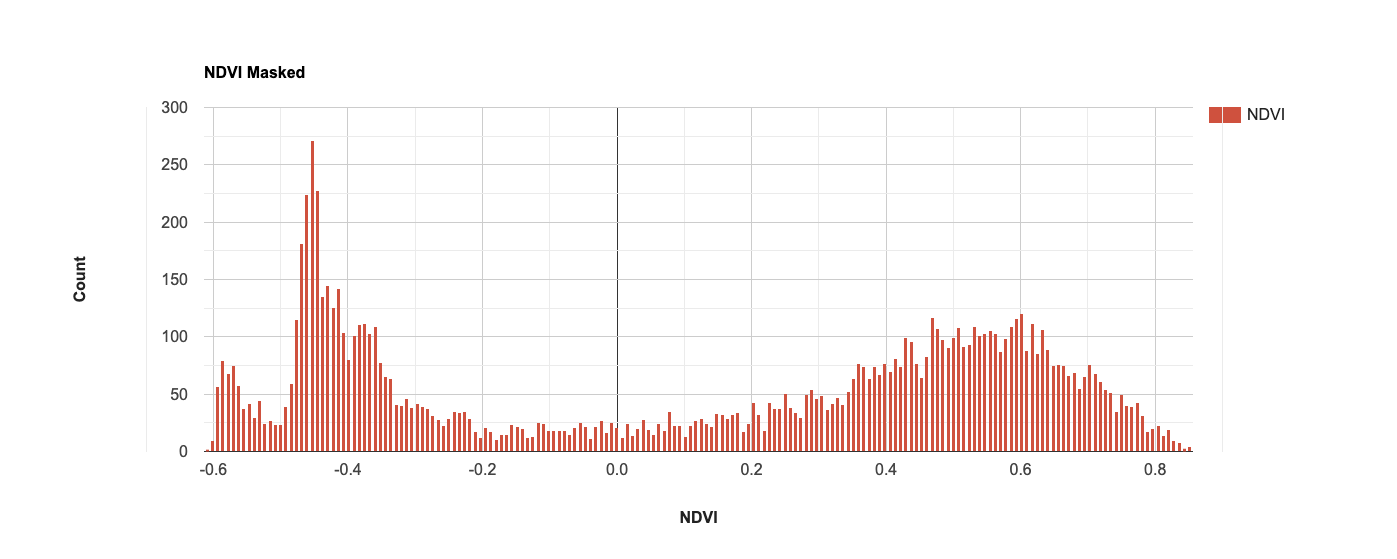
The issue you've run into is that you are trying to apply an image function to an imageCollection. The solution is to map the function to the image collection. However, I took the liberty of plotting a histogram of your "bad" NDVI data and I don't see any immediate issues with the values therein.
var landsat = ee.ImageCollection("LANDSAT/LC08/C02/T1_L2");
var aoi =
    /* color: #d63000 */
    /* shown: false */
    ee.Geometry.Polygon(
        [[[-90.28893540845067, 30.185849313602084],
          [-90.48119615063817, 29.540364376709284],
          [-89.43200181470067, 29.37774455816459],
          [-89.21502183423192, 30.15260570786985]]]),
    landsat = ee.ImageCollection("LANDSAT/LC08/C01/T1_SR");

//Image reduction
//Image 3: August-November, 2020
var images = ee.ImageCollection(landsat
.filterBounds(aoi)
.filter(ee.Filter.calendarRange(2020, 2020, 'year')));
var growing = ee.ImageCollection(images
.filter(ee.Filter.calendarRange(8, 11, 'month'))
.sort('CLOUD_COVER_LAND')
.first()
);
var clipGrowing20 = growing.map(function(image){return image.clip(aoi)}) ;
print ('Growing Season 2020:', clipGrowing20);

var addNDVI = function(image) {
  var ndvi = image.normalizedDifference(["B5","B4"])
    .rename('NDVI');
  return image.addBands(ndvi);
};

var collectionNDVI20 = clipGrowing20.map(addNDVI);
print ('Not Masked NDVI 2020: ', collectionNDVI20);
Map.addLayer(collectionNDVI20, {bands:"NDVI"}, "collectionNDVI20");

var badNDVI = collectionNDVI20.select('NDVI');
print("badNDVI",badNDVI);
Map.addLayer(badNDVI, {}, "badNDVI");
// Flip mask parameters.
var maskNDVI = function(image){
    var NDVI = image.select("NDVI");
    var t1 = image.updateMask(NDVI.lt(1));
    var t2 = t1.updateMask(NDVI.gt(-1));
    return(t2);
};
// Map mask to collection
var NDVImasked = collectionNDVI20.map(maskNDVI);
print("NDVImasked",NDVImasked);
Map.addLayer(NDVImasked, {}, "NDVImasked");
// Plot "Bad" data
var chart1 =
    ui.Chart.image.histogram({image: badNDVI.first(), region: aoi, scale: 900})
        .setSeriesNames(['NDVI'])
        .setOptions({
          title: 'NDVI Bad',
          hAxis: {
            title: 'NDVI',
            titleTextStyle: {italic: false, bold: true},
          },
          vAxis:
              {title: 'Count', titleTextStyle: {italic: false, bold: true}},
          colors: ['cf513e', '1d6b99', 'f0af07']
        });
print("Bad NDVI", chart1);
// Plot "masked" data
var chart2 =
    ui.Chart.image.histogram({image: NDVImasked.select("NDVI").first(), region: aoi, scale: 900})
        .setSeriesNames(['NDVI'])
        .setOptions({
          title: 'NDVI Masked',
          hAxis: {
            title: 'NDVI',
            titleTextStyle: {italic: false, bold: true},
          },
          vAxis:
              {title: 'Count', titleTextStyle: {italic: false, bold: true}},
          colors: ['cf513e', '1d6b99', 'f0af07']
        });
print("Masked NDVI", chart2);


