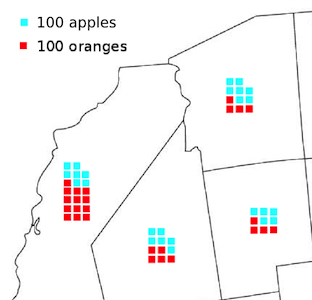
How would the type of map symbology illustrated here be typically described?

Specifically where symbology is used to represent arbitrary quantities of phenomena, and these being charted together for a particular zone. I'm looking for good examples of this type of approach (to compare favourably to the seeming preference these days that many people have for embedding pie charts inside polygons), but am not sure if there is a standardised term. Can anyone clarify?
I seem to remember a pretty good example of this approach focussed on the US western coast, but I forget the author and specific context..
