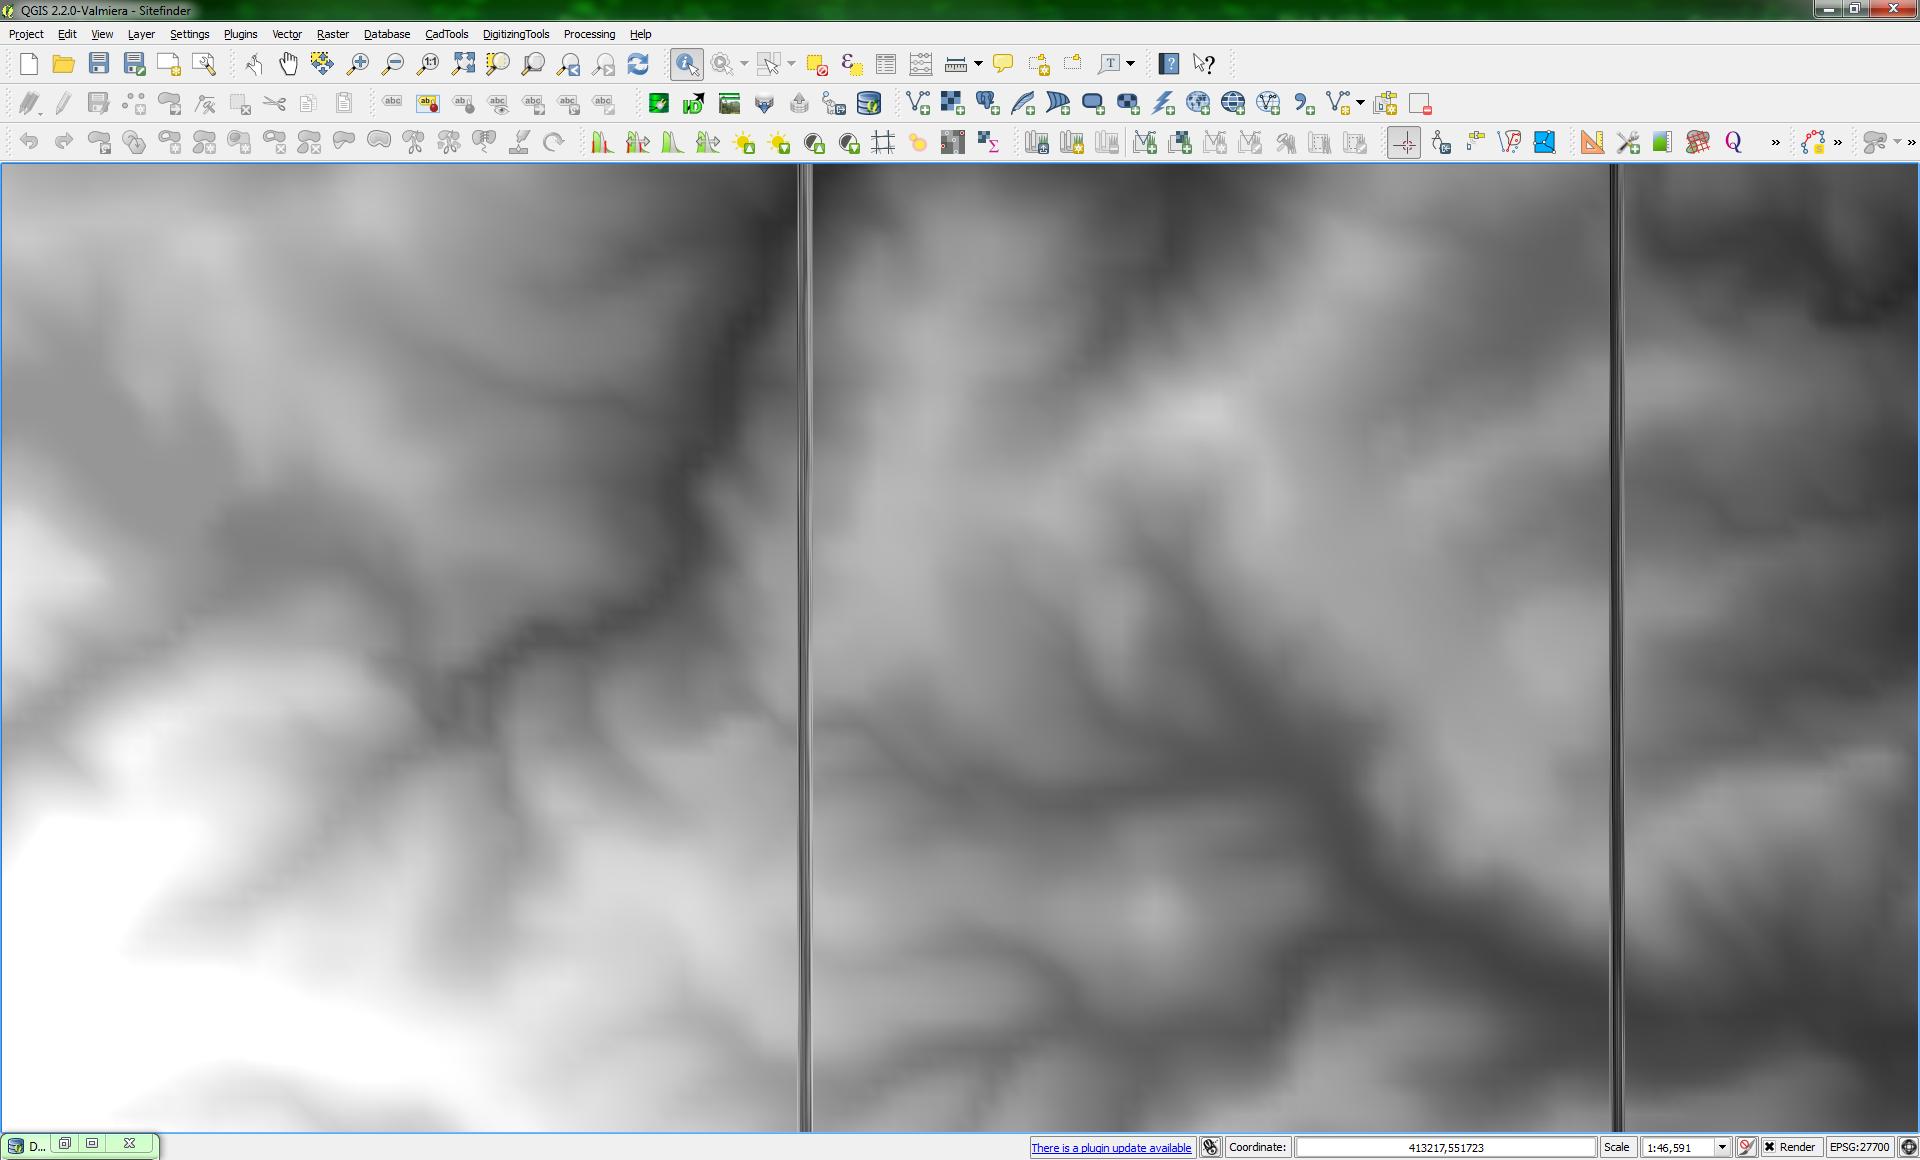
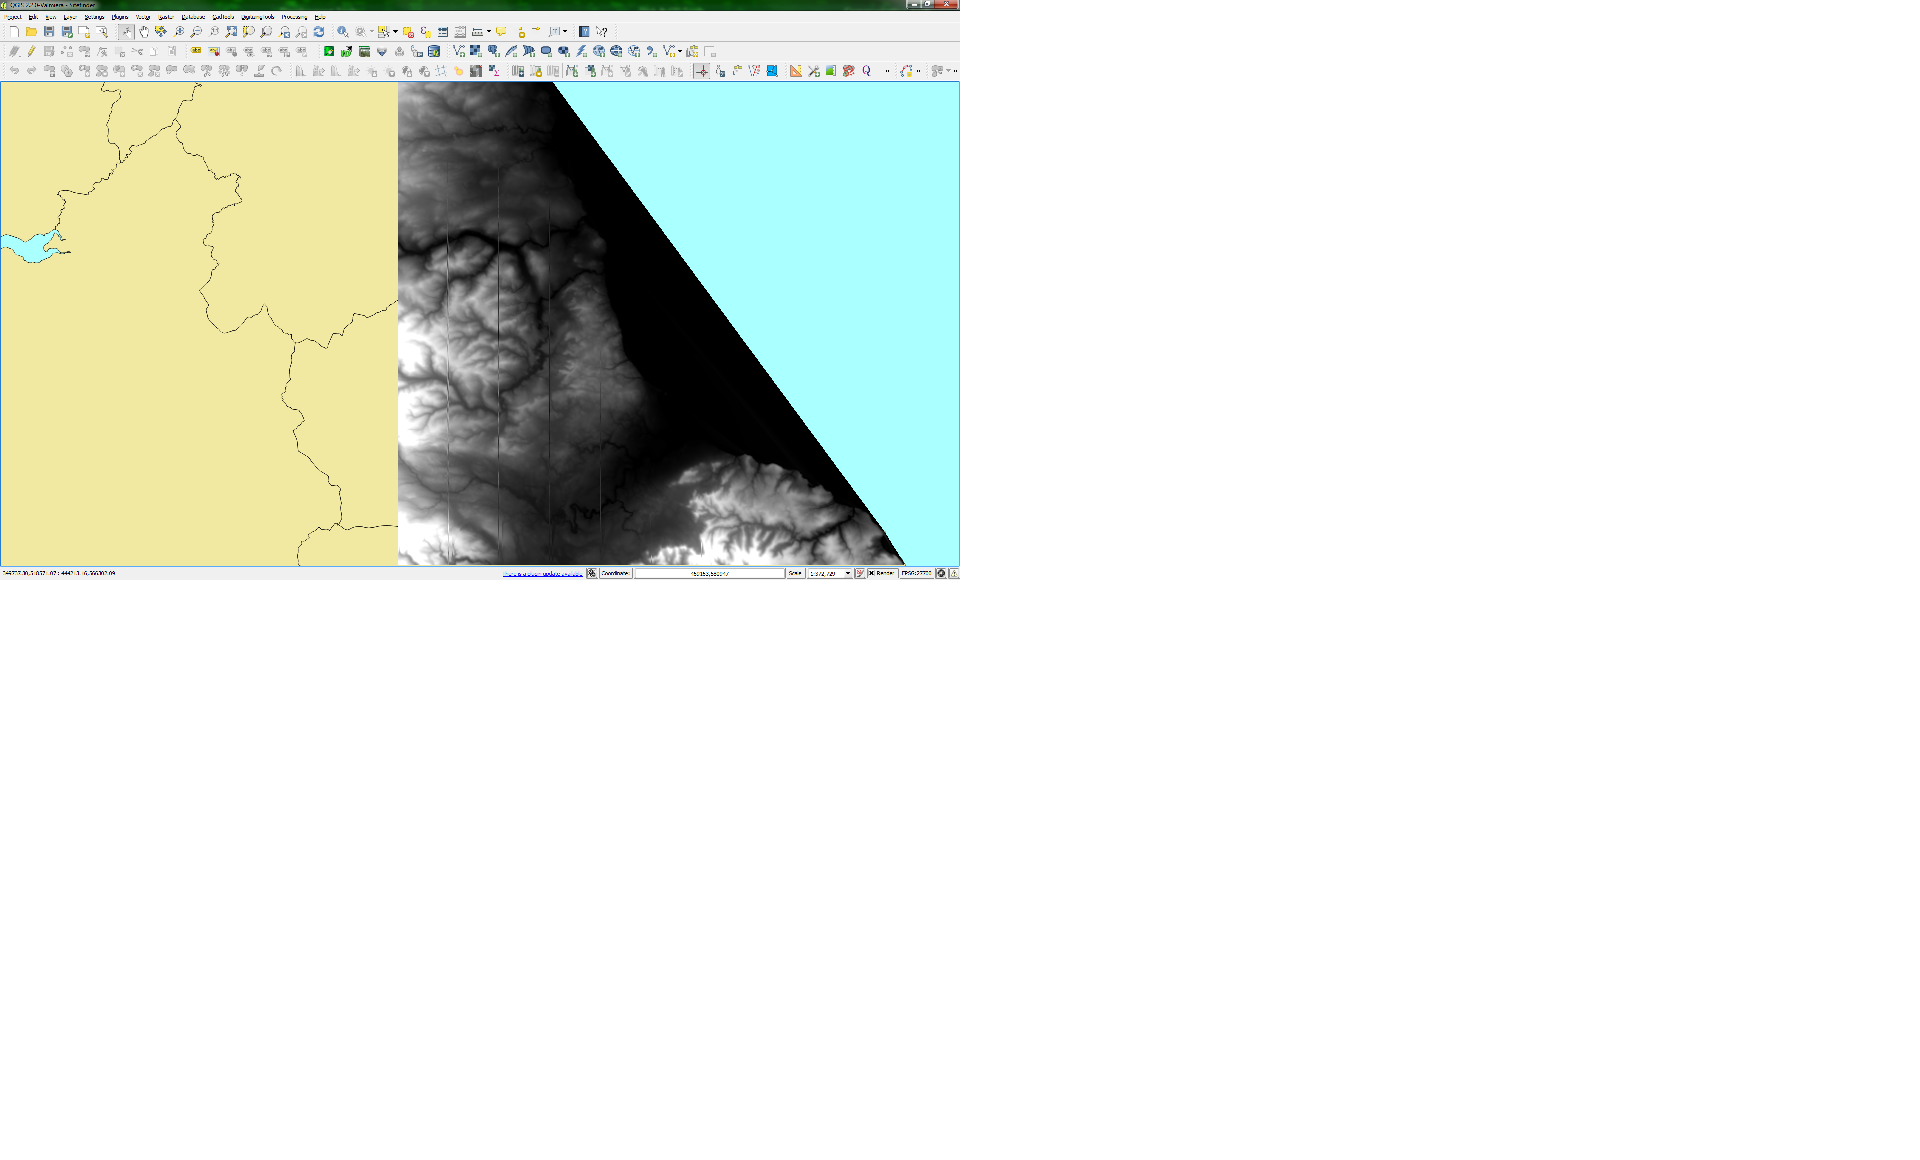
I can't seem to get rid of them, and I've no idea (OK scrap that, I have a vague idea) what's causing them.
First an apology, yes this is quite a large picture so apologies, but here goes:

How to reproduce
OK, so how did I end up with that.
-
- I downloaded the ess-sh meridian 2 map from the OS Open data site
-
- I unpacked the archive, and got the 'gridded height' folder
For the purposes of the image above, I only used the files in the NZ folder for now (I intend to do the entire UK once I perfect my method
-
- I used the QGIS shape merge tool to combine all the shape files in the NZ folder into one large NZ grid of height points, each point is 200 meters apart (According to the measure tool)
-
- I then loaded the combined shape file into QGIS, and did a visual inspection, each tile of points lined up perfectly, with no strange gaps (One tile starts 200 in from the edge of the tile, and the previous stops 200 after (That is it stops right on the grid square boundary (I've checked this using the OS grid locator shapes and everything is lined up on the boundaries using OSGB36)
-
- I then used the QGIS interpolation tool, with the following settings:
-
- Input layer : My NZ layer of gridded points
-
- Interpolation attribute : Height
-
- Interpolation method : TIN
-
- Num of columns : 10000
-
- Num of rows : 10000
-
- Cell size X : 9.98000 (Auto)
-
- Cell Size Y : 9.98000 (Auto)
-
- X min, Y Min : 400100, 500100 (Min extents of entire NZ area)
-
- X max, Y max : 499900, 599900 (Max extents of entire NZ area)
-
- Hit OK and waited for the raster to render, the result you see above.
What I suspect
I suspect that the bands are some artefact of the shape-file joiner either not joining the source files correctly, or the data in the grids not being what I expect it to be.
However, IF there is discrepancies in how the OS has mapped these (and it wouldn't be the first time) then looking at the boundaries of the sources pre merge, I believe that I should also see these bands running vertically too.
If anyone has any thoughts, I'd appreciate to hear them.
I'm putting this down for the night now, but I'll come back to it over the weekend.
Update 23/6/14
Sorry it's took me a little while to get back to this one.
I've since used a derivative of user30184's answer, which with a little help for here : http://darrencope.com/2010/05/07/merge-a-directory-of-shapefiles-using-ogr/ I turned into the following batch file:
@Echo off
Cls
if "%1" == "" goto NoParams

if not exist merged ( mkdir merged )

cd %1

for %%f in (*.shp) do (
if not exist ..\merged\%1merged.shp (
ogr2ogr -f "esri shapefile" ..\merged\%1merged.shp %%f -nln %1merged) else (
ogr2ogr -f "esri shapefile" -update -append ..\merged\%1merged.shp %%f -nln %1merged)
)

cd ..

goto Finished


:NoParams
ECHO This utility must be run from within the "Gridded_Height" folder as part of the OS     Meridian 2 map product
ECHO EG: merid2_essh_gb\data\Gridded_Height
ECHO.
ECHO When run, you must provide a 2 letter grid tile to process, the output of which     will be placed in a folder
ECHO called merged, EG: '%0 NZ'  will process all the shapes in the NZ tile square, and     produce
ECHO NZmerged.shp in the merged folder.
ECHO.

:Finished
Everything went smoothly, as anticipated, and so I ran the new shape file through the interpolation generator again, only to find that I still have these vertical lines on the raster.

As you can imagine, this is quite perplexing now, and I'm suspecting that either I have corrupted data (So am going to try and download a new copy) or ogr2ogr and other tools on the PC I'm using are broken (It is a possibility) so am going to try repeating the process on an entirely different machine and in a clean VM that's only ever had the geo tools I use installed.
For now however, still no dice, so all I can keep doing is fiddling, and see what happens.
I will keep this post updated in due course, if / when I get any further.
Update (2) 23/6/14 - Yes I've been working through the night
Further to the notes above, I've now taken the entire NZ layer and pushed the data into a PostGIS table, I've manually loaded each tile by hand, and then pulled this into QGIS and processed as described previously.
This has still produced the banding previously seen, but I now have some additional information.
Because I now have this in Postgres, I was able to overlay other layers onto the output in QGIS, doing this with the various grids I have from the Ordnance survey (I have a number of rectangular grids provided by them to aid positioning raster tiles), after trying a few different grids, Iv'e noted that these bands are exactly on the 10 km grid boundaries, but only vertically, horizontally works fine.
At this point I think I can rule out the shapefile merge tool in QGIS and any problems with Ogr2Ogr, this is now looking either like bad data (Which I have yet to find) or a problem in how the QGIS raster interpolation tool is producing the output.
Next step I think is going to be try the same procedure on a different machine, but accessing the same database data.
For reference (In case any one knows of any bugs) I'm using QGIS Valmiera (2.2.0)
in the process of loading all the shapes into individual tables inside Postgres, I came up with this script to merge them all into a single table (Posting it as it may be useful to others)
DO
$$
DECLARE
    tables        record;
    tablename     text;
    theschema     text;
    tile          text;
    tilenumber    text;
    sqlstring     text;

BEGIN

   SELECT 'temp' INTO theschema;

   FOR tables IN
      SELECT *
      FROM   pg_tables
      WHERE  schemaname = theschema
      ORDER  BY tablename
   LOOP

    SELECT quote_ident(tables.tablename) INTO tablename;
    SELECT substr(tables.tablename, 1 , 2) INTO tile;
    SELECT substr(tables.tablename, 3 , 2) INTO tilenumber;

    RAISE NOTICE 'Processing Table Name % (tile %, number %)', tablename, tile,     tilenumber;
    SELECT 'insert into meridian.gridded_height(originaltile, tilenumber, featurecode, height, geometry) (select ''' || tile || '''::character(2) as originaltile, ''' || tilenumber || '''::character(2) as tilenumber, "FEATURE_CO"::integer as featurecode, "HEIGHT" as height, geometry as geometry from ' || quote_ident(theschema) || '.' || tablename || ')' into sqlstring;
    EXECUTE sqlstring;

   END LOOP;
END$$;
The destination table schema the above script pushes the tile data into is:
CREATE TABLE meridian.gridded_height
(
  pkid serial NOT NULL,
  originaltile character(2),
  tilenumber character(2),
  featurecode integer,
  height double precision,
  geometry geometry(Point,27700),
  CONSTRAINT gridded_height_pkey PRIMARY KEY (pkid)
)
WITH (
  OIDS=FALSE
Update (3) 23/6/14
In follow up to user30184's most recent comment I'm using the following:
64 Bit Windows 7 with a 64 Bit build of QGIS, I don't have a separate install of GDAL (or any other geo utils, Ogr2Ogr as far as I'm aware runs out of my QGIS install)
Versions reported by QGIS (2.2.0 Valmiera) are as follows:
- QGIS version 2.2.0-Valmiera
- QGIS code revision c3a2817
- Compiled against Qt 4.8.5
- Running against Qt 4.8.5
- Compiled against GDAL/OGR 1.10.1
- Running against GDAL/OGR 1.10.1
- Compiled against GEOS 3.4.2-CAPI-1.8.2
- Running against GEOS 3.4.2-CAPI-1.8.2 r3921
- PostgreSQL Client Version 9.2.4
- SpatiaLite Version 4.1.1
- QWT Version 5.2.3
- PROJ.4 Version 480
- QScintilla2 Version 2.7.2
These versions have been taken directly from the QGIS about box
Further more, I've been doing some further analysis on the data.
The gridded height was apparently derived from the Landform panorama dataset sampled at 50 meters, however the distance between each point in the meridian grid appears to be 200 Meters.
When I overlay the 10 km grid (as previously mentioned) the grid lines run perfectly neatly between the grid points, looking at the co-ordinates of the height points, they are set in 100 meters from the edge of the grid, with 200 meter spacing.
This measures out at a 100 meter border between grid square edge and first column of points, but overall from the last column of the previous tile to the next, 200 meters to match the spacing for the rest correctly.
I've been trying different row and column counts in the interpolation generator, and have to some degree succeeded in removing some of the bands, and some combinations are worse than others, Iv'e not yet removed all of the bands, but given Iv'e found some changeable parameter that seems to be able to affect them, I believe that the data has not been produced in a fully suitable format by Ordnance survey to be used correctly for this purpose.
Following up on the new comments below, I'm going to try different versions of GDAL and co, see if that makes any difference at all.
Since last update, have also tried on a different machine, with same data and gotten the same results.
Update (4) 20/01/2015
Just thought I'd pop an update on here just to bring folks up to date.
I've still not solved this problem, and I'm still no closer to why it occurred.
However, as time was running out for me and with help from a friend who knows ArcMap, I converted the points into greyscale DEMs using ArcMap with no problems at all.
I can't remember off the top of my head the exact sequence, but I do know it was much longer than the QGIS way of doing it.
I will when I get time however come back to this and continue to find a solution.
Thanks so far to all those who've added information to this question, if anyone thinks of anything extra please do feel free to add it.
