10

As far as data goes, I'm working with NHD .shp files, 10m DEMs, and some LIDAR data.

My goal is to determine gradient for 100m segments of a network of streams.

I'm already able to do this, but I expect that my workflow is nonideal, especially in that I can't deal with branched networks at all.

If you all were going about this, what sort of steps would you use?

In addition, I posted about the problem here, where I think I did a much better job describing what my goals are.

6
  • The biggest issue is registering the datasets. It is unusual for the vector stream features to coincide with streams as identified from a DEM unless the vector features were derived directly from the DEM. Lack of coincidence can throw gradients way off: you frequently find water flowing upstream, for instance. Do you consider addressing this issue part of your "workflow" or do you assume the registration has already been carried out?
    – whuber
    Commented Apr 18, 2011 at 19:16
  • Certainly that is one of the problems I ran into trying to mesh the NHD stream centerlines with DEMs. Are there any good solutions as regards registering the two datasets? Commented Apr 18, 2011 at 19:22
  • Previously, we'd used a stream network derived from the LIDAR data itself, but I'd like to know how to do it otherwise. Commented Apr 18, 2011 at 19:23
  • At what scale were the stream centerlines collected? Seems like 100m segment length is a bit too small. When someone like you does work, it would sure be helpful if the results (like the streams derived from LIDAR) could be migrated back to one of the data stewards Commented Apr 18, 2011 at 20:30
  • LIDAR data I'm using is from Noah Snyder at BC, that's been processed down to a 1m DEM. Data originally collected in the Narraguagas watershed in Maine. You might be right as far as 100m being to small. I was hoping to get as accurate as realistically possible in order to try and automate the location of remnant dam in the stream, which is why I was looking for such a fine scale. Kirk, once I've finished this project I'll gladly run everything by you to make sure it's worth submitting to the USGS. Thanks for the comments everyone. Commented Apr 18, 2011 at 20:43

3 Answers 3

17
+50

Given that you have the LIDAR DEM, you should use the streams derived from it. That guarantees perfect registration.

The crux of the idea is to estimate mean slopes in terms of the elevations at the ends of the segments.

One of the easiest procedures is to "explode" the stream network into its component unbranched arcs. Convert the collection into a "route" layer based on distance, making it "measurable." Now it's straightforward to generate a collection of route "events" based on a table of milestones (at 100 m intervals for instance) for each arc and extract the DEM elevations from those event points. Successive differences of elevation along each arc, divided by 100m, estimate the mean segment slopes.

The following figure maps the arcs of streams derived from a flowaccumulation analysis of a USGS 7.5 minute DEM (part of Highland County, VA). It's about 10 km across (6 mi).
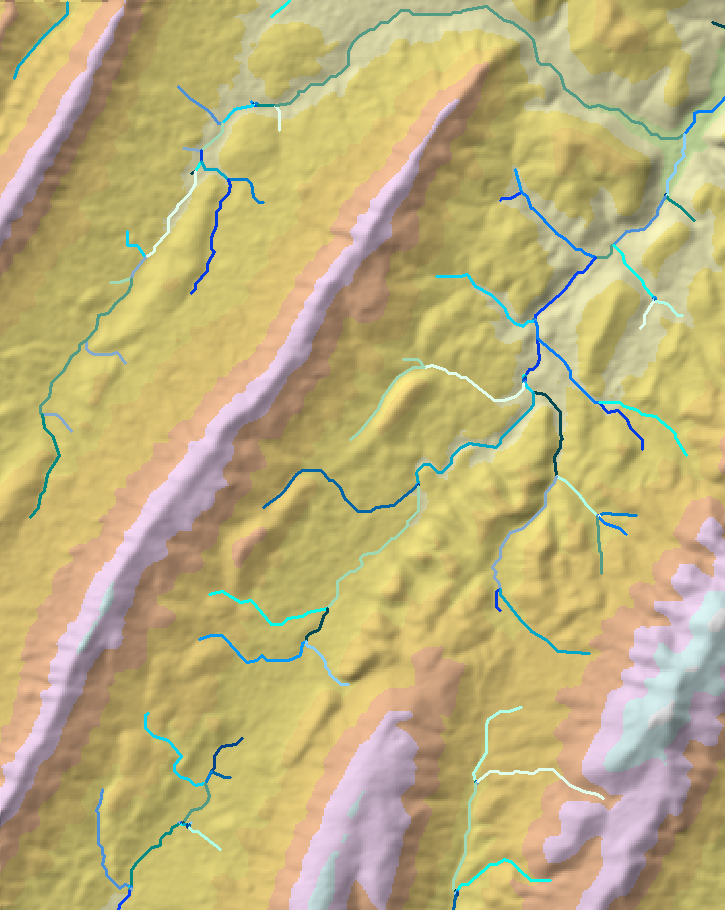
DEM

Since you're looking for a remnant dam, which might be indicated by a change in gradient over just a few tens of meters (for a very small dam), consider using even smaller segments. If the dataset is too rough to provide clear signals, you can easily filter it later (by means of moving averages or otherwise, such as splining plots of the elevations and differentiating the spline). In effect this approach puts you into the domain of time series analysis where the variable of interest is the elevation, not the gradient, and you're looking for patterns consisting of short level sections followed by sudden changes.
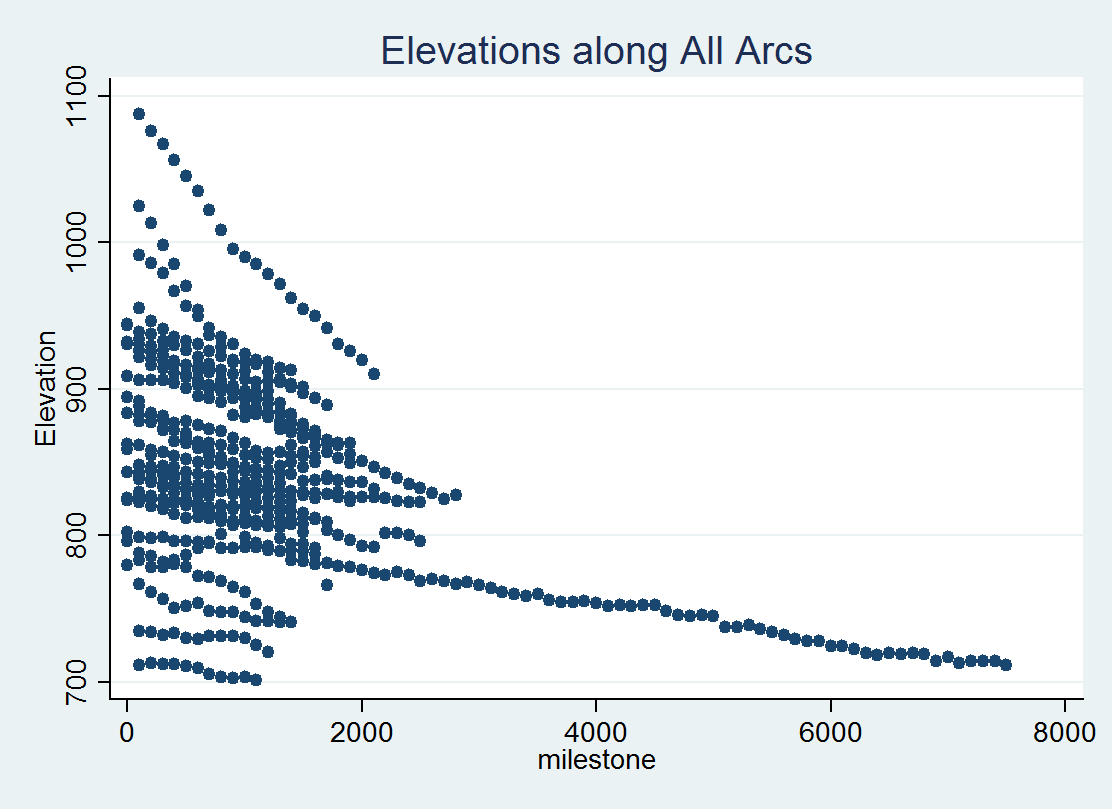
Elevation vs. milestone plots

This is a plot of DEM elevations observed at 100m intervals along most (not all) of the depicted stream segments. (The cellsize is 30m.) Where necessary, the arcs were reoriented to make elevation generally decrease from left to right. (If you look closely you can see where I missed one: it climbs from left to right.)
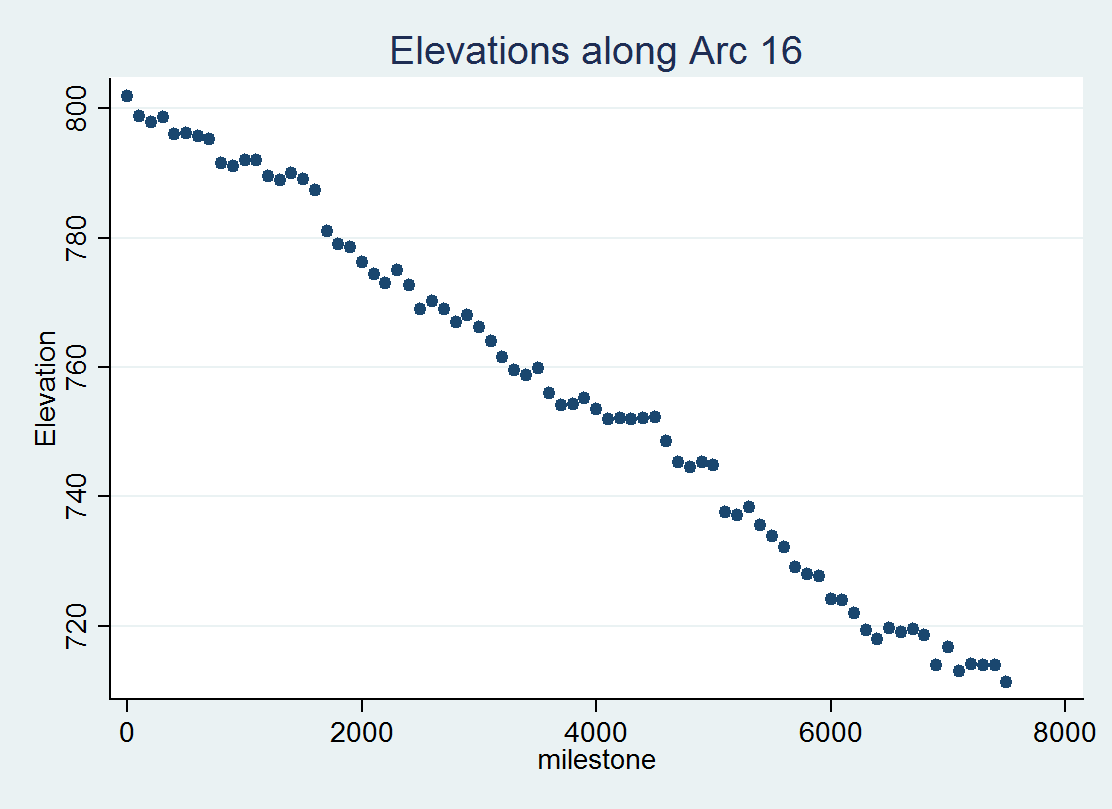
Elevation vs milestone on arc 16

This detail of arc 16 (the long segment at the top of the map) shows what you might get when the streams are not perfectly registered with the DEM: in places the stream appears to flow upwards. Nevertheless, segments suggesting pool-and-drop characteristics are readily identified, especially after milestones 1800 (meters along the segment), 4000, 4600, and 6500. This identification can be automated in various ways, especially after cleaning the elevation series (by smoothing it).

You can see that the 100 m sampling interval used here really isn't good enough to identify features much smaller 400-500 meters long. So, to find a small remnant dam, you probably would want to sample around a 10-25 m interval on your LIDAR DEM.

BTW, what makes a stream segment "too small" for this kind of work is neither a short length nor a large cellsize, although both play into the decision. "Too small" depends on how you will be using the estimated slopes and how uncertain those estimates might be. For some work it could even make sense to estimate gradients at 10m intervals over a 10m grid!

6
  • +1 great analysis. Any suggestions on how to apply (conflate?) reachcodes from the corresponding NHD flowlines onto the stream lines derived from the Lidar DEM? Commented Apr 22, 2011 at 18:28
  • @Kirk That's a tough and perceptive question; I consciously avoided addressing it in my analysis! Some recent questions on this site about comparing GPS tracks relate to a similar problem and suggest some useful solutions. The answer depends partly on how discrepant the two sets of (polyline) data are: small differences are easy to detect and correct automatically; larger differences can cause wholesale errors in finding matching segments.
    – whuber
    Commented Apr 22, 2011 at 18:34
  • @whuber Unlike the gps track problem, it seems like this one could leverage the DEM. If you pour water at a point on an NHD flowline, it seems like quite often it should flow over the Lidar DEM to the polyline generated from the Lidar (and which should correspond to the NHD's flowline). Granted, complete automation would still be unlikely, but still seems like the DEM could make the job easier. I guess braided streams would be the biggest pain. Commented Apr 22, 2011 at 19:05
  • @Kirk I drafted a comment specifically about exploiting the DEM but deleted it because it's speculative and could be wrong. That's to say, I think your idea is spot on, but implementing it requires some research. The problem is that the NHD lines will generally bounce back and forth between the valley walls of the LIDAR DEM, constantly changing the flow relationships between each NHD segment and its corresponding LIDAR-derived segment. This must be exploitable, but exactly how to do it efficiently and accurately is the question.
    – whuber
    Commented Apr 22, 2011 at 19:24
  • @whuber I see Katharine Kolb is presenting paper on this at the NHD Workshop coming up soon. Sure would be great if we could shift the discussion on-line. Given the budget cuts, I bet there'll be a lot of papers that get cancelled. So they might be willing to entertain a late entry paper (nudge-nudge). Commented Apr 22, 2011 at 20:01
1

I am doing some Hydrology analysis on my end and as I was to create my Flow Direction raster I remembered your post. This is just a stab in the dark but, in ArcGIS 10 there is an option to create an output drop raster. I wonder if it somehow could be used to solve your problem.

The drop raster shows the ratio of the maximum change in elevation from each cell along the direction of flow to the path length between centers of cells, expressed in percentages.

0

Jakub's answer is a good one, because it considers each cell with no need for further line splitting. If you combined a stream raster with flow accumulation along that stream raster you could get the distance along the stream and then graph out slope on the y-axis and stream distance on the x-axis. You would also need to account for diagonal distance, but this could be dealt with using Euclidean Direction.

Your Answer

By clicking “Post Your Answer”, you agree to our terms of service and acknowledge you have read our privacy policy.

Not the answer you're looking for? Browse other questions tagged or ask your own question.