added image
Source Link
Andy W
  • 4.3k
  • 5
  • 48
  • 70

Here is a really simple example

library(raster)
data(volcano)
volcanoR <- raster(volcano)

#making colors below 100 red and above 180 blue in this example

breakpoints <- c(94,100,120,140,160,180,195)
colors <- c("red","white","white","white","white","blue")
plot(volcanoR,breaks=breakpoints,col=colors)
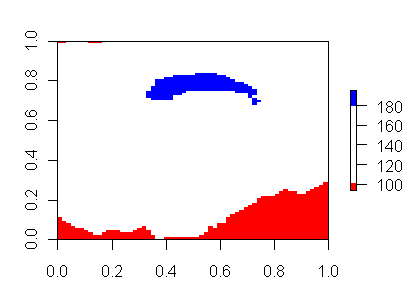
enter image description here

You just need to pass the plot a vector of break points and a vector of colors to match the breakpoints. Check out the RColorbrewer package for some very nice built in color ramps. Also check out the classInt package for making the breakpoints.

Here is a really simple example

library(raster)
data(volcano)
volcanoR <- raster(volcano)

#making colors below 100 red in this example

breakpoints <- c(94,100,120,140,160,180,195)
colors <- c("red","white","white","white","white","blue")
plot(volcanoR,breaks=breakpoints,col=colors)

You just need to pass the plot a vector of break points and a vector of colors to match the breakpoints. Check out the RColorbrewer package for some very nice built in color ramps. Also check out the classInt package for making the breakpoints.

Here is a really simple example

library(raster)
data(volcano)
volcanoR <- raster(volcano)

#making colors below 100 red and above 180 blue in this example

breakpoints <- c(94,100,120,140,160,180,195)
colors <- c("red","white","white","white","white","blue")
plot(volcanoR,breaks=breakpoints,col=colors)

enter image description here

You just need to pass the plot a vector of break points and a vector of colors to match the breakpoints. Check out the RColorbrewer package for some very nice built in color ramps. Also check out the classInt package for making the breakpoints.

Source Link
Andy W
  • 4.3k
  • 5
  • 48
  • 70

Here is a really simple example

library(raster)
data(volcano)
volcanoR <- raster(volcano)

#making colors below 100 red in this example

breakpoints <- c(94,100,120,140,160,180,195)
colors <- c("red","white","white","white","white","blue")
plot(volcanoR,breaks=breakpoints,col=colors)

You just need to pass the plot a vector of break points and a vector of colors to match the breakpoints. Check out the RColorbrewer package for some very nice built in color ramps. Also check out the classInt package for making the breakpoints.