Bumped by Community user
replaced http://stackoverflow.com/ with https://stackoverflow.com/
Source Link

I'm using plotrix in R to plot a state level map of the US. It has an excellent function floating.pie to put pie charts on each state.

I'm wondering if there are similar functions within the plotrix package to display bar charts in each state? (I took a look at the documentation and the functions that deal with bar charts don't seem to have this possibility, but I just wanted to be sure.) I prefer to work within the plotrix package if possible, but feel free to name other packages.

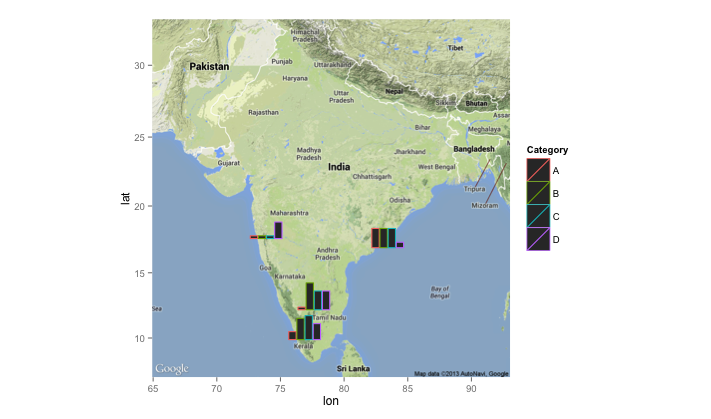
As an example, I would be interested in producing a map similar to this (but for the US):

enter image description here

For my US map, there would be 50 bar charts, one for each state.

I got this map from http://stackoverflow.com/questions/20465070/barplots-on-a-maphttps://stackoverflow.com/questions/20465070/barplots-on-a-map, but it seems that ggsubplot doesn't work on my version of R (similar to what others have been saying on the post).

I'm using plotrix in R to plot a state level map of the US. It has an excellent function floating.pie to put pie charts on each state.

I'm wondering if there are similar functions within the plotrix package to display bar charts in each state? (I took a look at the documentation and the functions that deal with bar charts don't seem to have this possibility, but I just wanted to be sure.) I prefer to work within the plotrix package if possible, but feel free to name other packages.

As an example, I would be interested in producing a map similar to this (but for the US):

enter image description here

For my US map, there would be 50 bar charts, one for each state.

I got this map from http://stackoverflow.com/questions/20465070/barplots-on-a-map, but it seems that ggsubplot doesn't work on my version of R (similar to what others have been saying on the post).

I'm using plotrix in R to plot a state level map of the US. It has an excellent function floating.pie to put pie charts on each state.

I'm wondering if there are similar functions within the plotrix package to display bar charts in each state? (I took a look at the documentation and the functions that deal with bar charts don't seem to have this possibility, but I just wanted to be sure.) I prefer to work within the plotrix package if possible, but feel free to name other packages.

As an example, I would be interested in producing a map similar to this (but for the US):

enter image description here

For my US map, there would be 50 bar charts, one for each state.

I got this map from https://stackoverflow.com/questions/20465070/barplots-on-a-map, but it seems that ggsubplot doesn't work on my version of R (similar to what others have been saying on the post).

Tweeted twitter.com/StackGIS/status/810241665327894533
edited title and tags for searchability
Source Link
Andre Silva
  • 10.3k
  • 12
  • 55
  • 109

Plotting bar charts on maps in plotrixR?

I'm using plotrix in R to plot a state level map of the US. It has an excellent function floating.pie to put pie charts on each state.

I'm wondering if there are similar functions within the plotrix package to display bar charts in each state? (I took a look at the documentation and the functions that deal with bar charts don't seem to have this possibility, but I just wanted to be sure.) I prefer to work within the plotrix package if possible, but feel free to name other packages.

As an example, I would be interested in producing a map similar to this (but for the US):

enter image description here

For my US map, there would be 50 bar charts, one for each state.

I got this map from http://stackoverflow.com/questions/20465070/barplots-on-a-map, but it seems that ggsubplot doesn't work on my version of R (similar to what others have been saying on the threadpost).

Plotting bar charts in plotrix

I'm using plotrix in R to plot a state level map of the US. It has an excellent function floating.pie to put pie charts on each state.

I'm wondering if there are similar functions within the plotrix package to display bar charts in each state? (I took a look at the documentation and the functions that deal with bar charts don't seem to have this possibility, but I just wanted to be sure.) I prefer to work within the plotrix package if possible, but feel free to name other packages.

As an example, I would be interested in producing a map similar to this (but for the US):

enter image description here

For my US map, there would be 50 bar charts, one for each state.

I got this map from http://stackoverflow.com/questions/20465070/barplots-on-a-map, but it seems that ggsubplot doesn't work on my version of R (similar to what others have been saying on the thread).

Plotting bar charts on maps in R?

I'm using plotrix in R to plot a state level map of the US. It has an excellent function floating.pie to put pie charts on each state.

I'm wondering if there are similar functions within the plotrix package to display bar charts in each state? (I took a look at the documentation and the functions that deal with bar charts don't seem to have this possibility, but I just wanted to be sure.) I prefer to work within the plotrix package if possible, but feel free to name other packages.

As an example, I would be interested in producing a map similar to this (but for the US):

enter image description here

For my US map, there would be 50 bar charts, one for each state.

I got this map from http://stackoverflow.com/questions/20465070/barplots-on-a-map, but it seems that ggsubplot doesn't work on my version of R (similar to what others have been saying on the post).

Post Reopened by Mapperz
added 456 characters in body
Source Link
wwl
  • 367
  • 1
  • 3
  • 11

I'm using plotrix in R to plot a state level map of the US. It has an excellent function floating.pie to put pie charts on each state.

I'm wondering if there are similar functions within the plotrix package to display bar charts in each statesstate? (I took a look at the documentation and the functions that deal with bar charts don't seem to have this possibility, but I just wanted to be sure.) I prefer to work within the plotrix package if possible, but feel free to name other packages.

As an example, I would be interested in producing a map similar to this (but for the US):

enter image description here

For my US map, there would be 50 bar charts, one for each state.

I got this map from http://stackoverflow.com/questions/20465070/barplots-on-a-map, but it seems that ggsubplot doesn't work on my version of R (similar to what others have been saying on the thread).

I'm using plotrix in R to plot a state level map of the US. It has an excellent function floating.pie to put pie charts on each state.

I'm wondering if there are similar functions within the plotrix package to display bar charts in each states? (I took a look at the documentation and the functions that deal with bar charts don't seem to have this possibility, but I just wanted to be sure.) I prefer to work within the plotrix package if possible, but feel free to name other packages.

I'm using plotrix in R to plot a state level map of the US. It has an excellent function floating.pie to put pie charts on each state.

I'm wondering if there are similar functions within the plotrix package to display bar charts in each state? (I took a look at the documentation and the functions that deal with bar charts don't seem to have this possibility, but I just wanted to be sure.) I prefer to work within the plotrix package if possible, but feel free to name other packages.

As an example, I would be interested in producing a map similar to this (but for the US):

enter image description here

For my US map, there would be 50 bar charts, one for each state.

I got this map from http://stackoverflow.com/questions/20465070/barplots-on-a-map, but it seems that ggsubplot doesn't work on my version of R (similar to what others have been saying on the thread).

Post Closed as "Needs details or clarity" by John Powell, nmtoken, Mapperz
corrected spelling, fixed grammar, improved formatting.
Link
whyzar
  • 12.1k
  • 23
  • 39
  • 72
Loading
Source Link
wwl
  • 367
  • 1
  • 3
  • 11
Loading