fix link
Source Link
Guz
  • 3.2k
  • 2
  • 19
  • 40

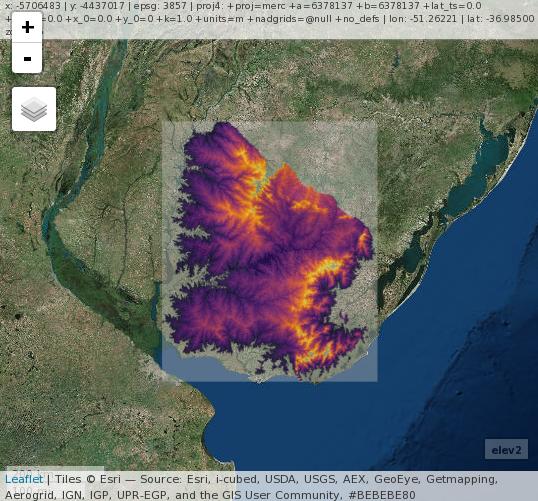
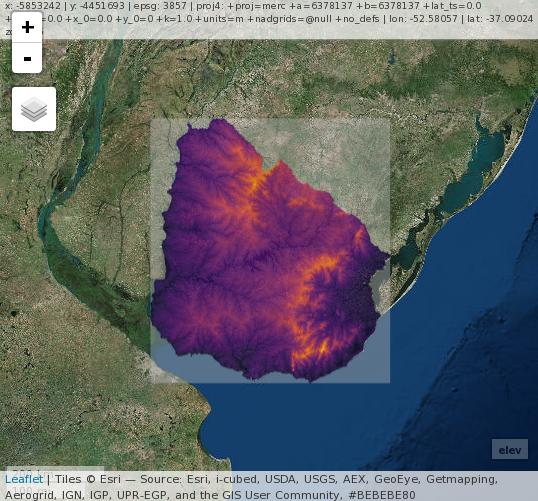
Try the commented and reproducible example below. You can assign NA values to your elevation RasterLayer as elev[elev < 0] <- NA and elev[elev > 1200] <- NA.

# Load libraries
library('raster')
library('rgdal')
library('mapview') # interactive map viewing in R

# Get DEM data example
elev <- getData('alt', country = 'URY')

rasterLayer

# Plot elevation data example 
mapview(elev)

# Define and query thresholds 
min <- 50
max <- 300

elev2 <- elev
elev2[elev <= min] <- NA
elev2[elev >= max] <- NA

# Plot elevation with threshold max min
mapview(elev2)

rasterlayer2

print(elev2) # see min and max values

#class       : RasterLayer 
#dimensions  : 612, 648, 396576  (nrow, ncol, ncell)
#resolution  : 0.008333333, 0.008333333  (x, y)
#extent      : -58.5, -53.1, -35.1, -30  (xmin, xmax, ymin, ymax)
#coord. ref. : +proj=longlat +datum=WGS84 +ellps=WGS84 +towgs84=0,0,0 
#data source : in memory
#names       : URY_msk_alt 
#values      : 51, 299  (min, max)

Note: more help and so nice information about rasters in R here Raster Data in R - The BasicsRaster Data in R - The Basics

Try the commented and reproducible example below. You can assign NA values to your elevation RasterLayer as elev[elev < 0] <- NA and elev[elev > 1200] <- NA.

# Load libraries
library('raster')
library('rgdal')
library('mapview') # interactive map viewing in R

# Get DEM data example
elev <- getData('alt', country = 'URY')

rasterLayer

# Plot elevation data example 
mapview(elev)

# Define and query thresholds 
min <- 50
max <- 300

elev2 <- elev
elev2[elev <= min] <- NA
elev2[elev >= max] <- NA

# Plot elevation with threshold max min
mapview(elev2)

rasterlayer2

print(elev2) # see min and max values

#class       : RasterLayer 
#dimensions  : 612, 648, 396576  (nrow, ncol, ncell)
#resolution  : 0.008333333, 0.008333333  (x, y)
#extent      : -58.5, -53.1, -35.1, -30  (xmin, xmax, ymin, ymax)
#coord. ref. : +proj=longlat +datum=WGS84 +ellps=WGS84 +towgs84=0,0,0 
#data source : in memory
#names       : URY_msk_alt 
#values      : 51, 299  (min, max)

Note: more help and so nice information about rasters in R here Raster Data in R - The Basics

add plots
Source Link
Guz
  • 3.2k
  • 2
  • 19
  • 40

Try the commented and reproducible example below. You can assign NA values to your elevation RasterLayer as elev[elev < 0] <- NA and elev[elev > 1200] <- NA.

# Load libraries
library('raster')
library('rgdal')
library('mapview') # interactive map viewing in R

# Get DEM data example
elev <- getData('alt', country = 'URY')
 

rasterLayer

# Plot elevation data example 
mapview(elev)

# Define and query thresholds 
min <- 50
max <- 300

elev2 <- elev
elev2[elev <= min] <- NA
elev2[elev >= max] <- NA

# Plot elevation with threshold max min
mapview(elev2)
 

rasterlayer2

print(elev2) # see min and max values

#class       : RasterLayer 
#dimensions  : 612, 648, 396576  (nrow, ncol, ncell)
#resolution  : 0.008333333, 0.008333333  (x, y)
#extent      : -58.5, -53.1, -35.1, -30  (xmin, xmax, ymin, ymax)
#coord. ref. : +proj=longlat +datum=WGS84 +ellps=WGS84 +towgs84=0,0,0 
#data source : in memory
#names       : URY_msk_alt 
#values      : 51, 299  (min, max)

Note: more help and so nice information about rasters in R here Raster Data in R - The Basics

Try the commented and reproducible example below. You can assign NA values to your elevation RasterLayer as elev[elev < 0] <- NA and elev[elev > 1200] <- NA.

# Load libraries
library('raster')
library('rgdal')
library('mapview') # interactive map viewing in R

# Get DEM data example
elev <- getData('alt', country = 'URY')
 
# Plot elevation data example 
mapview(elev)

# Define and query thresholds 
min <- 50
max <- 300

elev2 <- elev
elev2[elev <= min] <- NA
elev2[elev >= max] <- NA

# Plot elevation with threshold max min
mapview(elev2)
 
print(elev2)

#class       : RasterLayer 
#dimensions  : 612, 648, 396576  (nrow, ncol, ncell)
#resolution  : 0.008333333, 0.008333333  (x, y)
#extent      : -58.5, -53.1, -35.1, -30  (xmin, xmax, ymin, ymax)
#coord. ref. : +proj=longlat +datum=WGS84 +ellps=WGS84 +towgs84=0,0,0 
#data source : in memory
#names       : URY_msk_alt 
#values      : 51, 299  (min, max)

Note: more help and so nice information about rasters in R here Raster Data in R - The Basics

Try the commented and reproducible example below. You can assign NA values to your elevation RasterLayer as elev[elev < 0] <- NA and elev[elev > 1200] <- NA.

# Load libraries
library('raster')
library('rgdal')
library('mapview') # interactive map viewing in R

# Get DEM data example
elev <- getData('alt', country = 'URY')

rasterLayer

# Plot elevation data example 
mapview(elev)

# Define and query thresholds 
min <- 50
max <- 300

elev2 <- elev
elev2[elev <= min] <- NA
elev2[elev >= max] <- NA

# Plot elevation with threshold max min
mapview(elev2)

rasterlayer2

print(elev2) # see min and max values

#class       : RasterLayer 
#dimensions  : 612, 648, 396576  (nrow, ncol, ncell)
#resolution  : 0.008333333, 0.008333333  (x, y)
#extent      : -58.5, -53.1, -35.1, -30  (xmin, xmax, ymin, ymax)
#coord. ref. : +proj=longlat +datum=WGS84 +ellps=WGS84 +towgs84=0,0,0 
#data source : in memory
#names       : URY_msk_alt 
#values      : 51, 299  (min, max)

Note: more help and so nice information about rasters in R here Raster Data in R - The Basics

Source Link
Guz
  • 3.2k
  • 2
  • 19
  • 40

Try the commented and reproducible example below. You can assign NA values to your elevation RasterLayer as elev[elev < 0] <- NA and elev[elev > 1200] <- NA.

# Load libraries
library('raster')
library('rgdal')
library('mapview') # interactive map viewing in R

# Get DEM data example
elev <- getData('alt', country = 'URY')

# Plot elevation data example 
mapview(elev)

# Define and query thresholds 
min <- 50
max <- 300

elev2 <- elev
elev2[elev <= min] <- NA
elev2[elev >= max] <- NA

# Plot elevation with threshold max min
mapview(elev2)

print(elev2)

#class       : RasterLayer 
#dimensions  : 612, 648, 396576  (nrow, ncol, ncell)
#resolution  : 0.008333333, 0.008333333  (x, y)
#extent      : -58.5, -53.1, -35.1, -30  (xmin, xmax, ymin, ymax)
#coord. ref. : +proj=longlat +datum=WGS84 +ellps=WGS84 +towgs84=0,0,0 
#data source : in memory
#names       : URY_msk_alt 
#values      : 51, 299  (min, max)

Note: more help and so nice information about rasters in R here Raster Data in R - The Basics