4

I have a raster that displays elevational values at a global scale. I would like to set the minimum and maximum values based on the values I would like to choose.

> elev
class       : RasterLayer 
dimensions  : 18000, 43200, 777600000  (nrow, ncol, ncell)
resolution  : 0.008333334, 0.008333334  (x, y)
extent      : -180, 180, -60, 90.00001  (xmin, xmax, ymin, ymax)
coord. ref. : +proj=longlat +ellps=WGS84 +towgs84=0,0,0,0,0,0,0 +no_defs 
data source : E:\Data\Elevation_Data\alt\alt 
names       : alt 
values      : -431, 8233  (min, max)
attributes  :
     ID COUNT
 from: -431     2
 to  : 8233     1

> image(elev, zlim=c(0,1200))

The above command simply plots an image with the necessary values, but I would like a raster with just those limits.

Any thoughts?

1 Answer 1

5

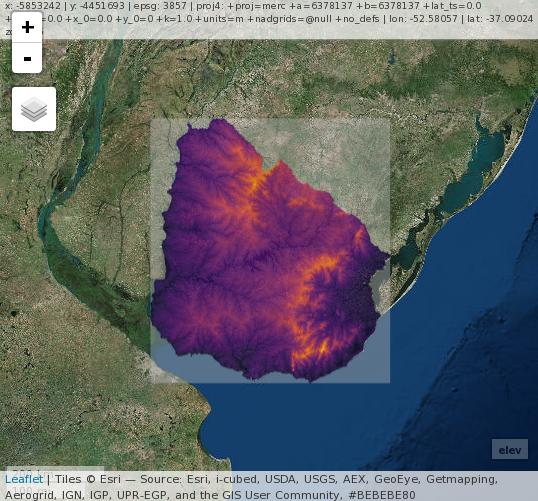
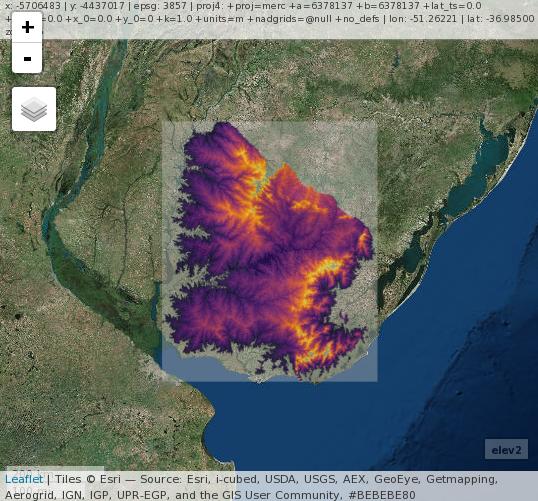
Try the commented and reproducible example below. You can assign NA values to your elevation RasterLayer as elev[elev < 0] <- NA and elev[elev > 1200] <- NA.

# Load libraries
library('raster')
library('rgdal')
library('mapview') # interactive map viewing in R

# Get DEM data example
elev <- getData('alt', country = 'URY')

rasterLayer

# Plot elevation data example 
mapview(elev)

# Define and query thresholds 
min <- 50
max <- 300

elev2 <- elev
elev2[elev <= min] <- NA
elev2[elev >= max] <- NA

# Plot elevation with threshold max min
mapview(elev2)

rasterlayer2

print(elev2) # see min and max values

#class       : RasterLayer 
#dimensions  : 612, 648, 396576  (nrow, ncol, ncell)
#resolution  : 0.008333333, 0.008333333  (x, y)
#extent      : -58.5, -53.1, -35.1, -30  (xmin, xmax, ymin, ymax)
#coord. ref. : +proj=longlat +datum=WGS84 +ellps=WGS84 +towgs84=0,0,0 
#data source : in memory
#names       : URY_msk_alt 
#values      : 51, 299  (min, max)

Note: more help and so nice information about rasters in R here Raster Data in R - The Basics

5
  • Thanks @Guzman for a detailed answer. Looks like this works, but takes a ton of time for a large raster that spans the entire globe. I am going to crop it to my region of interest and try it again. Commented May 23, 2017 at 16:01
  • 1
    @VijayRamesh you are welcome! Maybe you can parallelize the function using the parallel package to speed up the process. You can check this answer gis.stackexchange.com/questions/241255/… for help. It's not about querying rasters but you can get the logic behind parallel processing. And you will find more info there.
    – Guz
    Commented May 23, 2017 at 16:10
  • @Guzmán the link to Raster Data in R - The Basics is broken.
    – Vladimir
    Commented May 23, 2017 at 16:12
  • Also, thanks for the beautiful visualization using the mapview package. Seems like an excellent resource :) Commented May 23, 2017 at 16:15
  • @VijayRamesh I think mapview package is great! It really makes easy interact with spatial data in R.
    – Guz
    Commented May 23, 2017 at 16:17

Your Answer

By clicking “Post Your Answer”, you agree to our terms of service and acknowledge you have read our privacy policy.

Not the answer you're looking for? Browse other questions tagged or ask your own question.