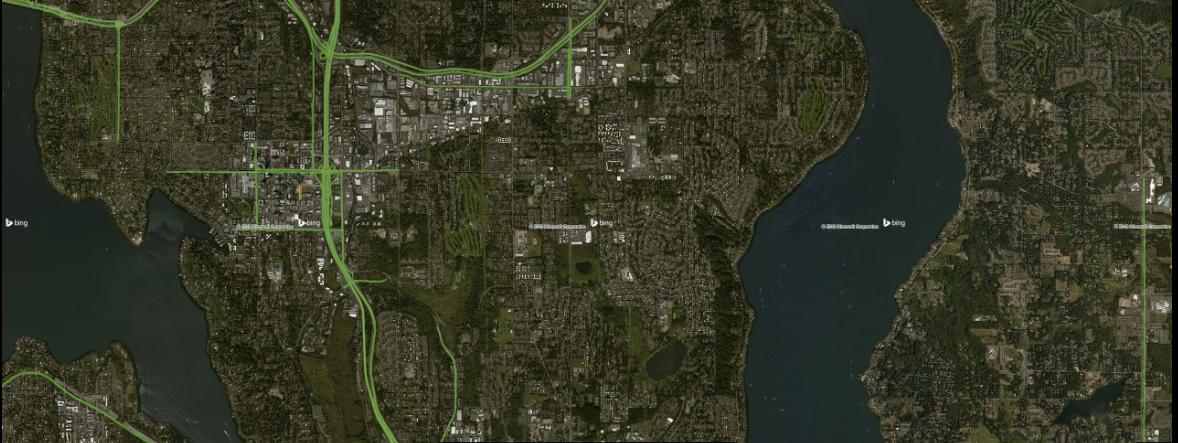
I have a screenshotstatic image of mapa Bing maps tile (Mercator EPSG: 3857) with satellite overlay in PNG format. I read the PNG as a raster and georeferenced it in R by setting the corner coordinates using the raster package.
HoweverHere is the original PNG. 
r <- raster("mymap.png")
# add coordinate system
crs(r) <- "+proj=merc +a=6378137 +b=6378137 +lat_ts=0.0 +lon_0=0.0 +x_0=0.0 +y_0=0 +k=1.0 +units=m +nadgrids=@null +wktext +no_defs"
# plot raster
plot(r)
# try some different colors, not true color though
colortable(r) <- rainbow(256)
plot(r)
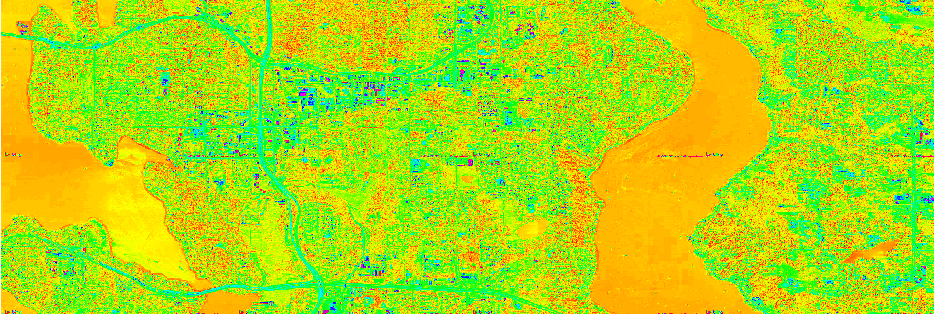
 However, when I try to plot the raster, I get some kooky colors. And when I export the raster as a GeoTIFFcan change the raster is in grayscale.
How do I displaycolortable, but it doesn't match the true colorscolor of the original PNG? And what. What is happening to the "color values" when I read a PNG with the raster package?
Here is the raster:
class       : RasterLayer
band        : 1  (of  3  bands)
dimensions  : 1280, 2560, 3276800  (nrow, ncol, ncell)
resolution  : 1, 1  (x, y)
extent      : 0, 2560, 0, 1280  (xmin, xmax, ymin, ymax)
coord. ref. : +proj=merc +a=6378137 +b=6378137 +lat_ts=0 +lon_0=0 +x_0=0 +y_0=0 +k=1 +units=m +nadgrids=@null +no_defs
data source : C:\Users\me\Documents\traffic\bing\images\mymap.png
names       : mymap
values      : 0, 255  (min, max)
I'm not entirely sure why it says there are 3 bands when this is just a single band PNG image.


