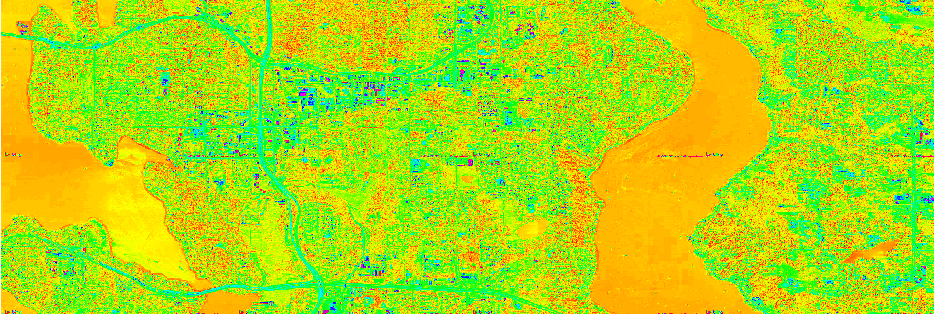
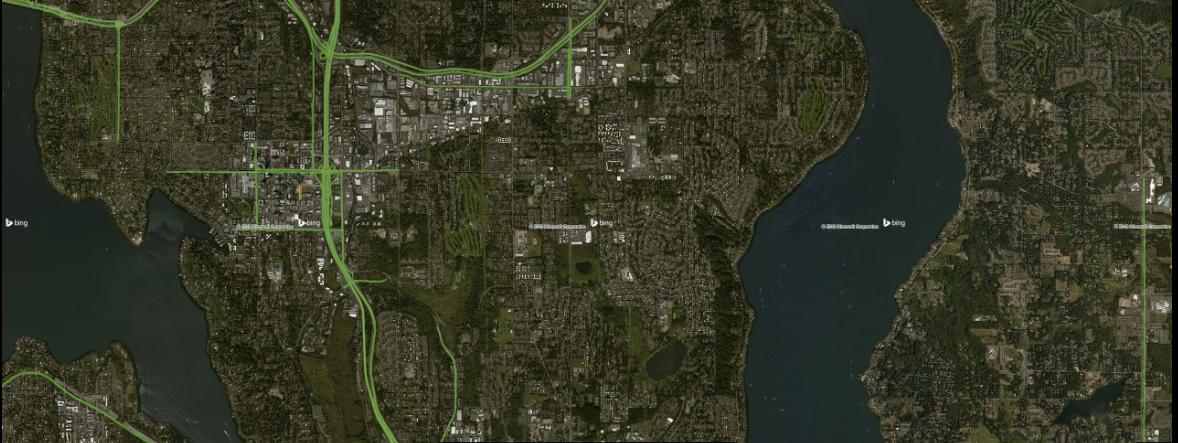
I have a static image of a Bing maps tile (Mercator EPSG: 3857) with satellite overlay in PNG format. I read the PNG as a raster and georeferenced it in R by setting the corner coordinates using the raster package.
r <- raster("mymap.png")
# add coordinate system
crs(r) <- "+proj=merc +a=6378137 +b=6378137 +lat_ts=0.0 +lon_0=0.0 +x_0=0.0 +y_0=0 +k=1.0 +units=m +nadgrids=@null +wktext +no_defs"
# plot raster
plot(r)
# try some different colors, not true color though
colortable(r) <- rainbow(256)
plot(r)
 However, when I try to plot the raster, I get some kooky colors. I can change the colortable, but it doesn't match the true color of the PNG. What is happening to the "color values" when I read a PNG with the
 raster package?
Here is the raster:
Formal class 'RasterLayer' [package "raster"] with 12 slots
  ..@ file    :Formal class '.RasterFile' [package "raster"] with 13 slots
  .. .. ..@ name        : chr "C:\\Users\\me\\Documents\\traffic\\bing\\images\\mymap.png"
  .. .. ..@ datanotation: chr "INT1U"
  .. .. ..@ byteorder   : chr "little"
  .. .. ..@ nodatavalue : num -Inf
  .. .. ..@ NAchanged   : logi FALSE
  .. .. ..@ nbands      : int 3
  .. .. ..@ bandorder   : chr "BIL"
  .. .. ..@ offset      : int 0
  .. .. ..@ toptobottom : logi TRUE
  .. .. ..@ blockrows   : int 1
  .. .. ..@ blockcols   : int 2560
  .. .. ..@ driver      : chr "gdal"
  .. .. ..@ open        : logi FALSE
  ..@ data    :Formal class '.SingleLayerData' [package "raster"] with 13 slots
  .. .. ..@ values    : logi(0)
  .. .. ..@ offset    : num 0
  .. .. ..@ gain      : num 1
  .. .. ..@ inmemory  : logi FALSE
  .. .. ..@ fromdisk  : logi TRUE
  .. .. ..@ isfactor  : logi FALSE
  .. .. ..@ attributes: list()
  .. .. ..@ haveminmax: logi TRUE
  .. .. ..@ min       : num 0
  .. .. ..@ max       : num 255
  .. .. ..@ band      : int 1
  .. .. ..@ unit      : chr ""
  .. .. ..@ names     : chr "mymap"
  ..@ legend  :Formal class '.RasterLegend' [package "raster"] with 5 slots
  .. .. ..@ type      : chr(0)
  .. .. ..@ values    : logi(0)
  .. .. ..@ color     : logi(0)
  .. .. ..@ names     : logi(0)
  .. .. ..@ colortable: logi(0)
  ..@ title   : chr(0)
  ..@ extent  :Formal class 'Extent' [package "raster"] with 4 slots
  .. .. ..@ xmin: num 0
  .. .. ..@ xmax: num 2560
  .. .. ..@ ymin: num 0
  .. .. ..@ ymax: num 1280
  ..@ rotated : logi FALSE
  ..@ rotation:Formal class '.Rotation' [package "raster"] with 2 slots
  .. .. ..@ geotrans: num(0)
  .. .. ..@ transfun:function ()
  ..@ ncols   : int 2560
  ..@ nrows   : int 1280
  ..@ crs     :Formal class 'CRS' [package "sp"] with 1 slot
  .. .. ..@ projargs: chr "+proj=merc +a=6378137 +b=6378137 +lat_ts=0 +lon_0=0 +x_0=0 +y_0=0 +k=1 +units=m +nadgrids=@null +no_defs"
  ..@ history : list()
  ..@ z       : list()
I'm not entirely sure why it says there are 3 bands when this is just a single band PNG image.


plotRGB()?plotRGBsays "unable to find an inherited method for function ‘plotRGB’ for signature ‘"RasterLayer"