Tweeted twitter.com/StackGIS/status/1240427905508917249
spelling and formatting
Source Link
nmtoken
  • 13.6k
  • 5
  • 38
  • 89

How do I combine Combine multiple USGS topo quads into a single seamless raster?

ImI'm quite new to GIS (so please be patient with my incorrect terminology) but ImI'm teaching myself as much as I can in order to create my own map of the Boundary Waters Canoe Area in northern Minnesota. My My goal is to keep the resolution high enough to be able have it printed when ImI'm done on a 10' x 5' banner for a wall in my basement. IveI've been collecting all of the feature data I will need for the various layers IdI'd like to add, campsitescamp sites, trails, lake depth contours, historical forest fire data, ectetc.

ImI'm using QGIS on OSX, and have successfully created the map with all of the different layers, but the map services IveI've found do not have high enough resolution - I believe I will ultimately need ~300 DPI. So I turned to the UGSGUSGS topos to create my own basemapbase map.

For my base map, IveI've downloaded ~65 USGS 7.5 minute topo quads. IveI've successfully used GDAL and converted all of my GeoPDFs to GeoTiffsGeoTIFFs in order for me to be able to use them in QGIS, dropping all of the layers I do not want. Next, I need to tile them together, which seems like it should be easy..... but....

But now ImI'm stuck because of the collars, those dang collars!

IveI've been exploring 2two different paths.

  1. Clipping / cropping / trimming the collars off of my tifsTIFFs. The only progress IveI've made here is using a 7.5 minute grid, creating a shape fileshapefile from each individual cell, then extracting each map file to the corresponding mask layer. Painful, and not perfect. I have small black spaces at each image intersection where the images overlap. This overlap issue leads to my second path:

  2. Using the current tifTIFF files with overlap but somehow merging them but always honoring the image that is not blank

Things IveI've explored: -SAGA mosaic doesnt work as my tif files have multiple bands -I havent been able to figure out how to use nearblack, but at one point it seemed promising -gdal warp seems like it might be an option but I havent been able to figure it out.

  • SAGA mosaic doesn't work as my TIFF files have multiple bands
  • I haven't been able to figure out how to use nearblack, but at one point it seemed promising
  • gdal warp seems like it might be an option but I haven't been able to figure it out.

ImI'm open to anything at this point, as ImI'm quite stuck.

In case it helps - here is gdalinfo for one of my images:

Files: O-MN_Lake_Agnes_20160511_TM_geo.tif.

Size is 6825, 8700 .

Coordinate System is:

PROJCS["NAD83 / UTM zone 15N",
GEOGCS["NAD83",
DATUM["North_American_Datum_1983",
SPHEROID["GRS 1980",6378137,298.257222101,
AUTHORITY["EPSG","7019"]],
TOWGS84[0,0,0,0,0,0,0],
AUTHORITY["EPSG","6269"]],
PRIMEM["Greenwich",0,
AUTHORITY["EPSG","8901"]],
UNIT["degree",0.0174532925199433,
AUTHORITY["EPSG","9122"]],
AUTHORITY["EPSG","4269"]],
PROJECTION["Transverse_Mercator"],
PARAMETER["latitude_of_origin",0],
PARAMETER["central_meridian",-93],
PARAMETER["scale_factor",0.9996],
PARAMETER["false_easting",500000],
PARAMETER["false_northing",0],
UNIT["metre",1,
AUTHORITY["EPSG","9001"]],
AXIS["Easting",EAST],
AXIS["Northing",NORTH],
AUTHORITY["EPSG","26915"]] . GeoTransform = . 562647.9383617276, 2.031842193813695, 0.02475724967923335 . 5345953.334329214, 0.02475724967923335, -2.031842193813695 . Metadata:
AREA_OR_POINT=Area . AUTHOR=USGS National Geospatial Technical Operations Center . CREATION_DATE=D:20160511071429Z . CREATOR=ESRI ArcSOC 10.0.2.3200 . KEYWORDS=Topographic, Transportation, Hydrography, Orthoimage, U.S. National Grid, imageryBaseMapsEarthCover, Imagery and Base Maps, Geographic Names Information System

NEATLINE=POLYGON ((574476.409995194 5330616.81030751,565063.890498903 5330502.12222002,564893.116537944 5344517.64268281,574305.636034233 5344632.3307703,574476.409995194 5330616.81030751)) .

SUBJECT=This image map depicts geographic features on the surface of the earth. It was created to provide a representation of accessible geospatial data which is readily available to enhance the capability of Federal, State, and local emergency responders for homeland security efforts. This image map is generated from selected National Map data holdings and other cartographic data.

TITLE=USGS 7.5-minute image map for Lake Agnes, Minnesota Image Structure Metadata:

INTERLEAVE=PIXEL .

Corner Coordinates:
Upper Left ( 562647.938, 5345953.334) ( 92d 9'21.06"W, 48d15'49.28"N)

Lower Left ( 562863.326, 5328276.307) ( 92d 9'20.03"W, 48d 6'16.73"N)

Upper Right ( 576515.261, 5346122.303) ( 91d58' 8.38"W, 48d15'49.27"N)

Lower Right ( 576730.649, 5328445.275) ( 91d58' 9.43"W, 48d 6'16.73"N)

Center ( 569689.294, 5337199.305) ( 92d 3'44.73"W, 48d11' 3.14"N)

Band 1 Block=6825x1 Type=Byte, ColorInterp=Red Band 2 Block=6825x1 Type=Byte, ColorInterp=Green Band 3 Block=6825x1 Type=Byte, ColorInterp=Blue

Files: O-MN_Lake_Agnes_20160511_TM_geo.tif. 

Size is 6825, 8700 . 

Coordinate System is:  

PROJCS["NAD83 / UTM zone 15N",  
    GEOGCS["NAD83",  
        DATUM["North_American_Datum_1983",  
            SPHEROID["GRS 1980",6378137,298.257222101,  
                AUTHORITY["EPSG","7019"]],  
            TOWGS84[0,0,0,0,0,0,0],  
            AUTHORITY["EPSG","6269"]],  
        PRIMEM["Greenwich",0,  
            AUTHORITY["EPSG","8901"]],   
        UNIT["degree",0.0174532925199433,  
            AUTHORITY["EPSG","9122"]],  
        AUTHORITY["EPSG","4269"]],  
    PROJECTION["Transverse_Mercator"],  
    PARAMETER["latitude_of_origin",0],  
    PARAMETER["central_meridian",-93],  
    PARAMETER["scale_factor",0.9996],  
    PARAMETER["false_easting",500000],  
    PARAMETER["false_northing",0],  
    UNIT["metre",1,  
        AUTHORITY["EPSG","9001"]],  
    AXIS["Easting",EAST],  
    AXIS["Northing",NORTH],  
    AUTHORITY["EPSG","26915"]] . 
GeoTransform = . 
  562647.9383617276, 2.031842193813695, 0.02475724967923335 . 
  5345953.334329214, 0.02475724967923335, -2.031842193813695 . 
Metadata:  
  AREA_OR_POINT=Area . 
  AUTHOR=USGS National Geospatial Technical Operations Center . 
  CREATION_DATE=D:20160511071429Z . 
  CREATOR=ESRI ArcSOC 10.0.2.3200 . 
  KEYWORDS=Topographic, Transportation, Hydrography, Orthoimage, U.S. National Grid, imageryBaseMapsEarthCover, Imagery and Base Maps, Geographic Names Information System

  NEATLINE=POLYGON ((574476.409995194 5330616.81030751,565063.890498903 5330502.12222002,564893.116537944 5344517.64268281,574305.636034233 5344632.3307703,574476.409995194 5330616.81030751)) . 

  SUBJECT=This image map depicts geographic features on the surface of the earth.  It was created to provide a representation of accessible geospatial data which is readily available to enhance the capability of Federal, State, and local emergency responders for homeland security efforts.  This image map is generated from selected National Map data holdings and other cartographic data.

  TITLE=USGS 7.5-minute image map for Lake Agnes, Minnesota
Image Structure Metadata:

  INTERLEAVE=PIXEL . 

Corner Coordinates:  
Upper Left  (  562647.938, 5345953.334) ( 92d 9'21.06"W, 48d15'49.28"N)

Lower Left  (  562863.326, 5328276.307) ( 92d 9'20.03"W, 48d 6'16.73"N)
 
Upper Right (  576515.261, 5346122.303) ( 91d58' 8.38"W, 48d15'49.27"N)
 
Lower Right (  576730.649, 5328445.275) ( 91d58' 9.43"W, 48d 6'16.73"N)
 
Center      (  569689.294, 5337199.305) ( 92d 3'44.73"W, 48d11' 3.14"N) 
  
Band 1 Block=6825x1 Type=Byte, ColorInterp=Red
Band 2 Block=6825x1 Type=Byte, ColorInterp=Green
Band 3 Block=6825x1 Type=Byte, ColorInterp=Blue

How do I combine multiple USGS topo quads into a single seamless raster?

Im quite new to GIS (so please be patient with my incorrect terminology) but Im teaching myself as much as I can in order to create my own map of the Boundary Waters Canoe Area in northern Minnesota. My goal is to keep the resolution high enough to be able have it printed when Im done on a 10' x 5' banner for a wall in my basement. Ive been collecting all of the feature data I will need for the various layers Id like to add, campsites, trails, lake depth contours, historical forest fire data, ect.

Im using QGIS on OSX, and have successfully created the map with all of the different layers, but the map services Ive found do not have high enough resolution - I believe I will ultimately need ~300 DPI. So I turned to the UGSG topos to create my own basemap.

For my base map, Ive downloaded ~65 USGS 7.5 minute topo quads. Ive successfully used GDAL and converted all of my GeoPDFs to GeoTiffs in order for me to be able to use them in QGIS, dropping all of the layers I do not want. Next, I need to tile them together, which seems like it should be easy..... but....

But now Im stuck because of the collars, those dang collars!

Ive been exploring 2 different paths.

  1. Clipping / cropping / trimming the collars off of my tifs. The only progress Ive made here is using a 7.5 minute grid, creating a shape file from each individual cell, then extracting each map file to the corresponding mask layer. Painful, and not perfect. I have small black spaces at each image intersection where the images overlap. This overlap issue leads to my second path:

  2. Using the current tif files with overlap but somehow merging them but always honoring the image that is not blank

Things Ive explored: -SAGA mosaic doesnt work as my tif files have multiple bands -I havent been able to figure out how to use nearblack, but at one point it seemed promising -gdal warp seems like it might be an option but I havent been able to figure it out.

Im open to anything at this point, as Im quite stuck.

In case it helps - here is gdalinfo for one of my images:

Files: O-MN_Lake_Agnes_20160511_TM_geo.tif.

Size is 6825, 8700 .

Coordinate System is:

PROJCS["NAD83 / UTM zone 15N",
GEOGCS["NAD83",
DATUM["North_American_Datum_1983",
SPHEROID["GRS 1980",6378137,298.257222101,
AUTHORITY["EPSG","7019"]],
TOWGS84[0,0,0,0,0,0,0],
AUTHORITY["EPSG","6269"]],
PRIMEM["Greenwich",0,
AUTHORITY["EPSG","8901"]],
UNIT["degree",0.0174532925199433,
AUTHORITY["EPSG","9122"]],
AUTHORITY["EPSG","4269"]],
PROJECTION["Transverse_Mercator"],
PARAMETER["latitude_of_origin",0],
PARAMETER["central_meridian",-93],
PARAMETER["scale_factor",0.9996],
PARAMETER["false_easting",500000],
PARAMETER["false_northing",0],
UNIT["metre",1,
AUTHORITY["EPSG","9001"]],
AXIS["Easting",EAST],
AXIS["Northing",NORTH],
AUTHORITY["EPSG","26915"]] . GeoTransform = . 562647.9383617276, 2.031842193813695, 0.02475724967923335 . 5345953.334329214, 0.02475724967923335, -2.031842193813695 . Metadata:
AREA_OR_POINT=Area . AUTHOR=USGS National Geospatial Technical Operations Center . CREATION_DATE=D:20160511071429Z . CREATOR=ESRI ArcSOC 10.0.2.3200 . KEYWORDS=Topographic, Transportation, Hydrography, Orthoimage, U.S. National Grid, imageryBaseMapsEarthCover, Imagery and Base Maps, Geographic Names Information System

NEATLINE=POLYGON ((574476.409995194 5330616.81030751,565063.890498903 5330502.12222002,564893.116537944 5344517.64268281,574305.636034233 5344632.3307703,574476.409995194 5330616.81030751)) .

SUBJECT=This image map depicts geographic features on the surface of the earth. It was created to provide a representation of accessible geospatial data which is readily available to enhance the capability of Federal, State, and local emergency responders for homeland security efforts. This image map is generated from selected National Map data holdings and other cartographic data.

TITLE=USGS 7.5-minute image map for Lake Agnes, Minnesota Image Structure Metadata:

INTERLEAVE=PIXEL .

Corner Coordinates:
Upper Left ( 562647.938, 5345953.334) ( 92d 9'21.06"W, 48d15'49.28"N)

Lower Left ( 562863.326, 5328276.307) ( 92d 9'20.03"W, 48d 6'16.73"N)

Upper Right ( 576515.261, 5346122.303) ( 91d58' 8.38"W, 48d15'49.27"N)

Lower Right ( 576730.649, 5328445.275) ( 91d58' 9.43"W, 48d 6'16.73"N)

Center ( 569689.294, 5337199.305) ( 92d 3'44.73"W, 48d11' 3.14"N)

Band 1 Block=6825x1 Type=Byte, ColorInterp=Red Band 2 Block=6825x1 Type=Byte, ColorInterp=Green Band 3 Block=6825x1 Type=Byte, ColorInterp=Blue

Combine multiple USGS topo quads into a single seamless raster?

I'm quite new to GIS (so please be patient with my incorrect terminology) but I'm teaching myself as much as I can in order to create my own map of the Boundary Waters Canoe Area in northern Minnesota. My goal is to keep the resolution high enough to be able have it printed when I'm done on a 10' x 5' banner for a wall in my basement. I've been collecting all of the feature data I will need for the various layers I'd like to add, camp sites, trails, lake depth contours, historical forest fire data, etc.

I'm using QGIS on OSX, and have successfully created the map with all of the different layers, but the map services I've found do not have high enough resolution - I believe I will ultimately need ~300 DPI. So I turned to the USGS topos to create my own base map.

For my base map, I've downloaded ~65 USGS 7.5 minute topo quads. I've successfully used GDAL and converted all of my GeoPDFs to GeoTIFFs in order for me to be able to use them in QGIS, dropping all of the layers I do not want. Next, I need to tile them together, which seems like it should be easy... but...

But now I'm stuck because of the collars, those dang collars!

I've been exploring two different paths.

  1. Clipping / cropping / trimming the collars off of my TIFFs. The only progress I've made here is using a 7.5 minute grid, creating a shapefile from each individual cell, then extracting each map file to the corresponding mask layer. Painful, and not perfect. I have small black spaces at each image intersection where the images overlap. This overlap issue leads to my second path:

  2. Using the current TIFF files with overlap but somehow merging them but always honoring the image that is not blank

Things I've explored:

  • SAGA mosaic doesn't work as my TIFF files have multiple bands
  • I haven't been able to figure out how to use nearblack, but at one point it seemed promising
  • gdal warp seems like it might be an option but I haven't been able to figure it out.

I'm open to anything at this point, as I'm quite stuck.

In case it helps - here is gdalinfo for one of my images:

Files: O-MN_Lake_Agnes_20160511_TM_geo.tif. 

Size is 6825, 8700 . 

Coordinate System is:  

PROJCS["NAD83 / UTM zone 15N",  
    GEOGCS["NAD83",  
        DATUM["North_American_Datum_1983",  
            SPHEROID["GRS 1980",6378137,298.257222101,  
                AUTHORITY["EPSG","7019"]],  
            TOWGS84[0,0,0,0,0,0,0],  
            AUTHORITY["EPSG","6269"]],  
        PRIMEM["Greenwich",0,  
            AUTHORITY["EPSG","8901"]],   
        UNIT["degree",0.0174532925199433,  
            AUTHORITY["EPSG","9122"]],  
        AUTHORITY["EPSG","4269"]],  
    PROJECTION["Transverse_Mercator"],  
    PARAMETER["latitude_of_origin",0],  
    PARAMETER["central_meridian",-93],  
    PARAMETER["scale_factor",0.9996],  
    PARAMETER["false_easting",500000],  
    PARAMETER["false_northing",0],  
    UNIT["metre",1,  
        AUTHORITY["EPSG","9001"]],  
    AXIS["Easting",EAST],  
    AXIS["Northing",NORTH],  
    AUTHORITY["EPSG","26915"]] . 
GeoTransform = . 
  562647.9383617276, 2.031842193813695, 0.02475724967923335 . 
  5345953.334329214, 0.02475724967923335, -2.031842193813695 . 
Metadata:  
  AREA_OR_POINT=Area . 
  AUTHOR=USGS National Geospatial Technical Operations Center . 
  CREATION_DATE=D:20160511071429Z . 
  CREATOR=ESRI ArcSOC 10.0.2.3200 . 
  KEYWORDS=Topographic, Transportation, Hydrography, Orthoimage, U.S. National Grid, imageryBaseMapsEarthCover, Imagery and Base Maps, Geographic Names Information System

  NEATLINE=POLYGON ((574476.409995194 5330616.81030751,565063.890498903 5330502.12222002,564893.116537944 5344517.64268281,574305.636034233 5344632.3307703,574476.409995194 5330616.81030751)) . 

  SUBJECT=This image map depicts geographic features on the surface of the earth.  It was created to provide a representation of accessible geospatial data which is readily available to enhance the capability of Federal, State, and local emergency responders for homeland security efforts.  This image map is generated from selected National Map data holdings and other cartographic data.

  TITLE=USGS 7.5-minute image map for Lake Agnes, Minnesota
Image Structure Metadata:

  INTERLEAVE=PIXEL . 

Corner Coordinates:  
Upper Left  (  562647.938, 5345953.334) ( 92d 9'21.06"W, 48d15'49.28"N)

Lower Left  (  562863.326, 5328276.307) ( 92d 9'20.03"W, 48d 6'16.73"N)
 
Upper Right (  576515.261, 5346122.303) ( 91d58' 8.38"W, 48d15'49.27"N)
 
Lower Right (  576730.649, 5328445.275) ( 91d58' 9.43"W, 48d 6'16.73"N)
 
Center      (  569689.294, 5337199.305) ( 92d 3'44.73"W, 48d11' 3.14"N) 
  
Band 1 Block=6825x1 Type=Byte, ColorInterp=Red
Band 2 Block=6825x1 Type=Byte, ColorInterp=Green
Band 3 Block=6825x1 Type=Byte, ColorInterp=Blue
added gdalinfo
Source Link
Jerod
  • 51
  • 1
  • 4

In case it helps - here is gdalinfo for one of my images:

Files: O-MN_Lake_Agnes_20160511_TM_geo.tif.

Size is 6825, 8700 .

Coordinate System is:

PROJCS["NAD83 / UTM zone 15N",
GEOGCS["NAD83",
DATUM["North_American_Datum_1983",
SPHEROID["GRS 1980",6378137,298.257222101,
AUTHORITY["EPSG","7019"]],
TOWGS84[0,0,0,0,0,0,0],
AUTHORITY["EPSG","6269"]],
PRIMEM["Greenwich",0,
AUTHORITY["EPSG","8901"]],
UNIT["degree",0.0174532925199433,
AUTHORITY["EPSG","9122"]],
AUTHORITY["EPSG","4269"]],
PROJECTION["Transverse_Mercator"],
PARAMETER["latitude_of_origin",0],
PARAMETER["central_meridian",-93],
PARAMETER["scale_factor",0.9996],
PARAMETER["false_easting",500000],
PARAMETER["false_northing",0],
UNIT["metre",1,
AUTHORITY["EPSG","9001"]],
AXIS["Easting",EAST],
AXIS["Northing",NORTH],
AUTHORITY["EPSG","26915"]] . GeoTransform = . 562647.9383617276, 2.031842193813695, 0.02475724967923335 . 5345953.334329214, 0.02475724967923335, -2.031842193813695 . Metadata:
AREA_OR_POINT=Area . AUTHOR=USGS National Geospatial Technical Operations Center . CREATION_DATE=D:20160511071429Z . CREATOR=ESRI ArcSOC 10.0.2.3200 . KEYWORDS=Topographic, Transportation, Hydrography, Orthoimage, U.S. National Grid, imageryBaseMapsEarthCover, Imagery and Base Maps, Geographic Names Information System

NEATLINE=POLYGON ((574476.409995194 5330616.81030751,565063.890498903 5330502.12222002,564893.116537944 5344517.64268281,574305.636034233 5344632.3307703,574476.409995194 5330616.81030751)) .

SUBJECT=This image map depicts geographic features on the surface of the earth. It was created to provide a representation of accessible geospatial data which is readily available to enhance the capability of Federal, State, and local emergency responders for homeland security efforts. This image map is generated from selected National Map data holdings and other cartographic data.

TITLE=USGS 7.5-minute image map for Lake Agnes, Minnesota Image Structure Metadata:

INTERLEAVE=PIXEL .

Corner Coordinates:
Upper Left ( 562647.938, 5345953.334) ( 92d 9'21.06"W, 48d15'49.28"N)

Lower Left ( 562863.326, 5328276.307) ( 92d 9'20.03"W, 48d 6'16.73"N)

Upper Right ( 576515.261, 5346122.303) ( 91d58' 8.38"W, 48d15'49.27"N)

Lower Right ( 576730.649, 5328445.275) ( 91d58' 9.43"W, 48d 6'16.73"N)

Center ( 569689.294, 5337199.305) ( 92d 3'44.73"W, 48d11' 3.14"N)

Band 1 Block=6825x1 Type=Byte, ColorInterp=Red Band 2 Block=6825x1 Type=Byte, ColorInterp=Green Band 3 Block=6825x1 Type=Byte, ColorInterp=Blue

Source Link
Jerod
  • 51
  • 1
  • 4

How do I combine multiple USGS topo quads into a single seamless raster?

Im quite new to GIS (so please be patient with my incorrect terminology) but Im teaching myself as much as I can in order to create my own map of the Boundary Waters Canoe Area in northern Minnesota. My goal is to keep the resolution high enough to be able have it printed when Im done on a 10' x 5' banner for a wall in my basement. Ive been collecting all of the feature data I will need for the various layers Id like to add, campsites, trails, lake depth contours, historical forest fire data, ect.

Im using QGIS on OSX, and have successfully created the map with all of the different layers, but the map services Ive found do not have high enough resolution - I believe I will ultimately need ~300 DPI. So I turned to the UGSG topos to create my own basemap.

For my base map, Ive downloaded ~65 USGS 7.5 minute topo quads. Ive successfully used GDAL and converted all of my GeoPDFs to GeoTiffs in order for me to be able to use them in QGIS, dropping all of the layers I do not want. Next, I need to tile them together, which seems like it should be easy..... but....

But now Im stuck because of the collars, those dang collars!

Ive been exploring 2 different paths.

  1. Clipping / cropping / trimming the collars off of my tifs. The only progress Ive made here is using a 7.5 minute grid, creating a shape file from each individual cell, then extracting each map file to the corresponding mask layer. Painful, and not perfect. I have small black spaces at each image intersection where the images overlap. This overlap issue leads to my second path:

  2. Using the current tif files with overlap but somehow merging them but always honoring the image that is not blank

Things Ive explored: -SAGA mosaic doesnt work as my tif files have multiple bands -I havent been able to figure out how to use nearblack, but at one point it seemed promising -gdal warp seems like it might be an option but I havent been able to figure it out.

Im open to anything at this point, as Im quite stuck.

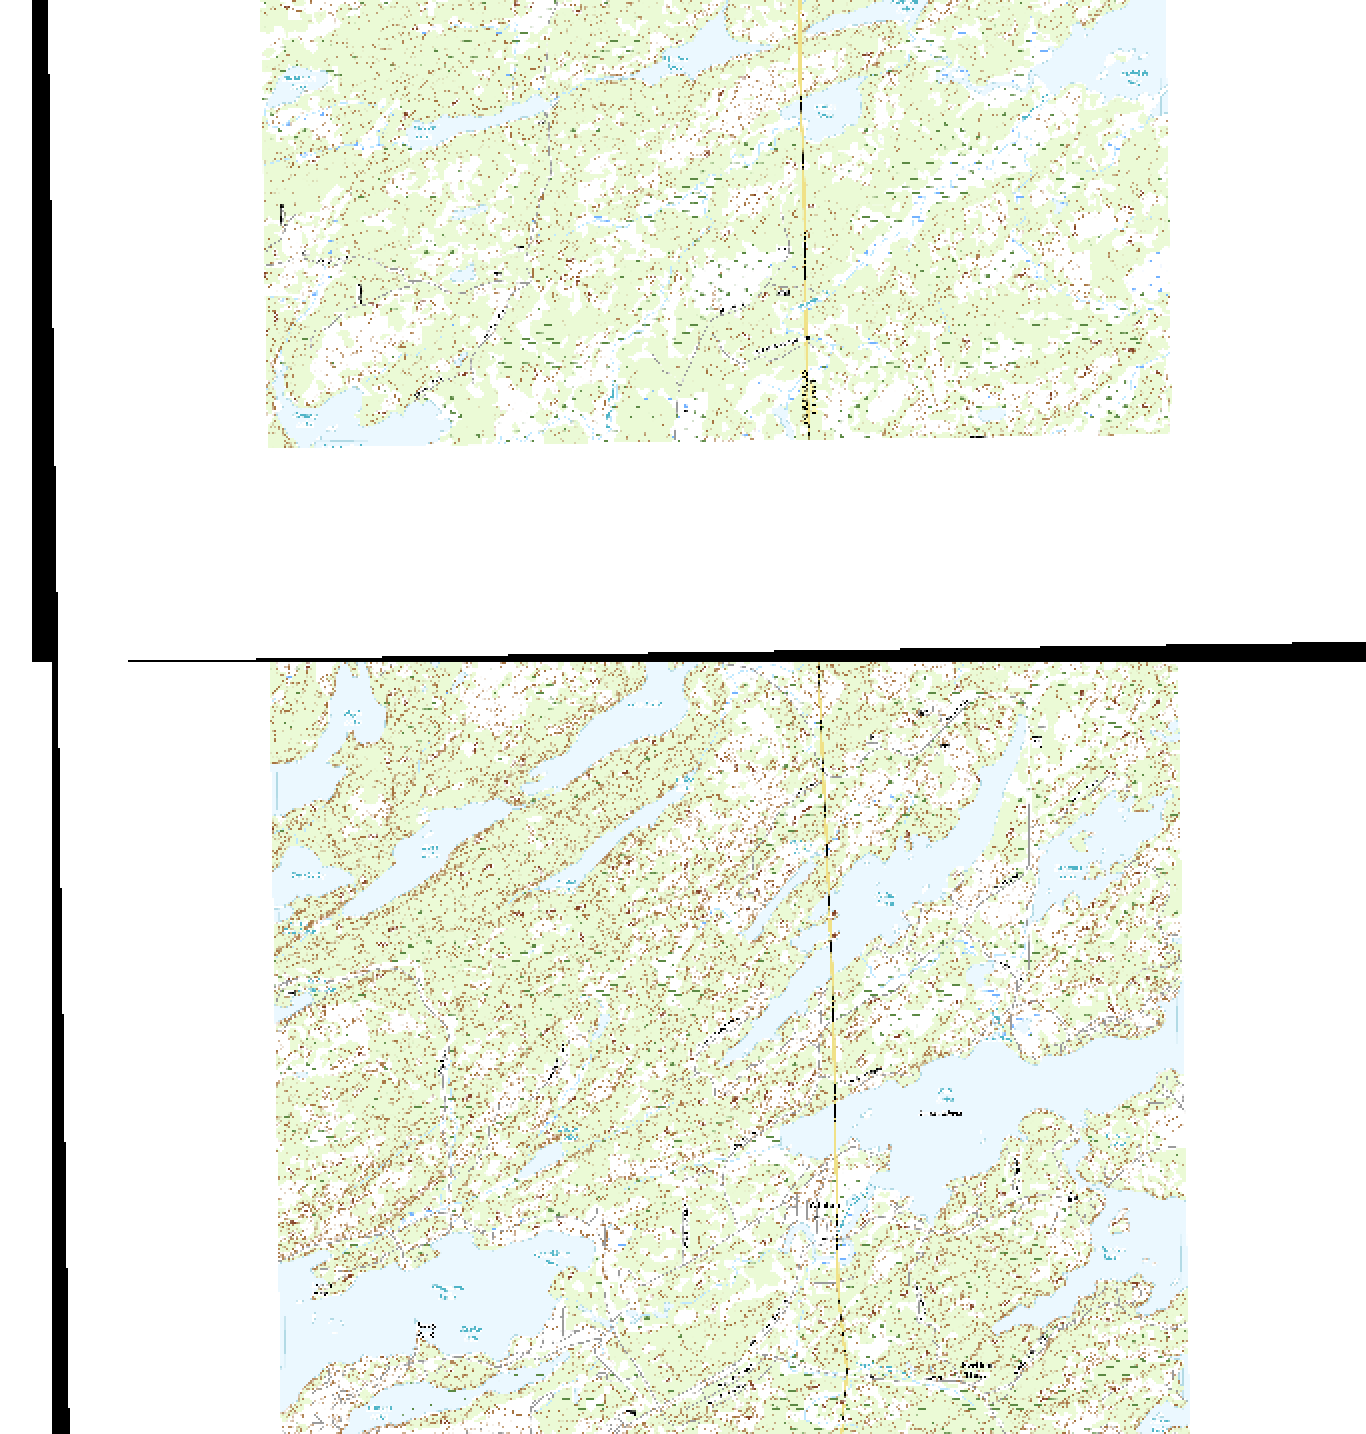
Below is just a sample of an overlap where the white collar of the upper image is covering up a portion of the map on the lower image.

Let me know what other details are needed.

example of collars covering up at overlaps