added 8 characters in body
Source Link
PolyGeo
  • 65.4k
  • 29
  • 114
  • 345

The Intensity int column has the ability to store all the treeID values. There is a slightly different format for copying rows to another and you can find the locations using str(las1). Additionally, some NA values were discovered from points not allocated, which I have remedied below as this initially failed to enable writing the .las successfully. Once imported into ArcGIS Pro adjust the Symbology to draw using intensity creating a custom Value Source and random Color scheme setting your max number of of identified trees value as highlighted in the screenshot, this gave better visual results showing less adjacent trees being coloured similarly. The data clearly displays individual trees satisfactorily with some adjustment lowering the Symbol scale.

library(lidR)
library(dplyr)

# Import the las and segment the trees
LASfile <- system.file("extdata", "MixedConifer.laz", package="lidR")
las <- readLAS(LASfile)
las1 <- segment_trees(las, li2012())

# remove points that are not assigned to a tree
trees = filter_poi(las1, !is.na(treeID))  # remove NA
col <- random.colors(100)
plot(trees, color = "treeID", colorPalette = col)

# format for copying rows to overwrite 
las1$Intensity = las1$treeID 
head(trees)  # checking first few rows copied

trees = filter_poi(las1, !is.na(Intensity))  # remove all NA values from here too
writeLAS(las = trees, file = "ntrees.las")
max(trees$Intensity, na.rm = TRUE)  # check max number of identified trees 

Screenshot below of my zoomed ArcPROArcGIS Pro working with less than 65,535 treeID (Intensity attribute is 16 bits) from the above code but loading a significantly larger.las file than the example, this consisted of 130 Mb or 30 million data points consisting of 4532 trees.

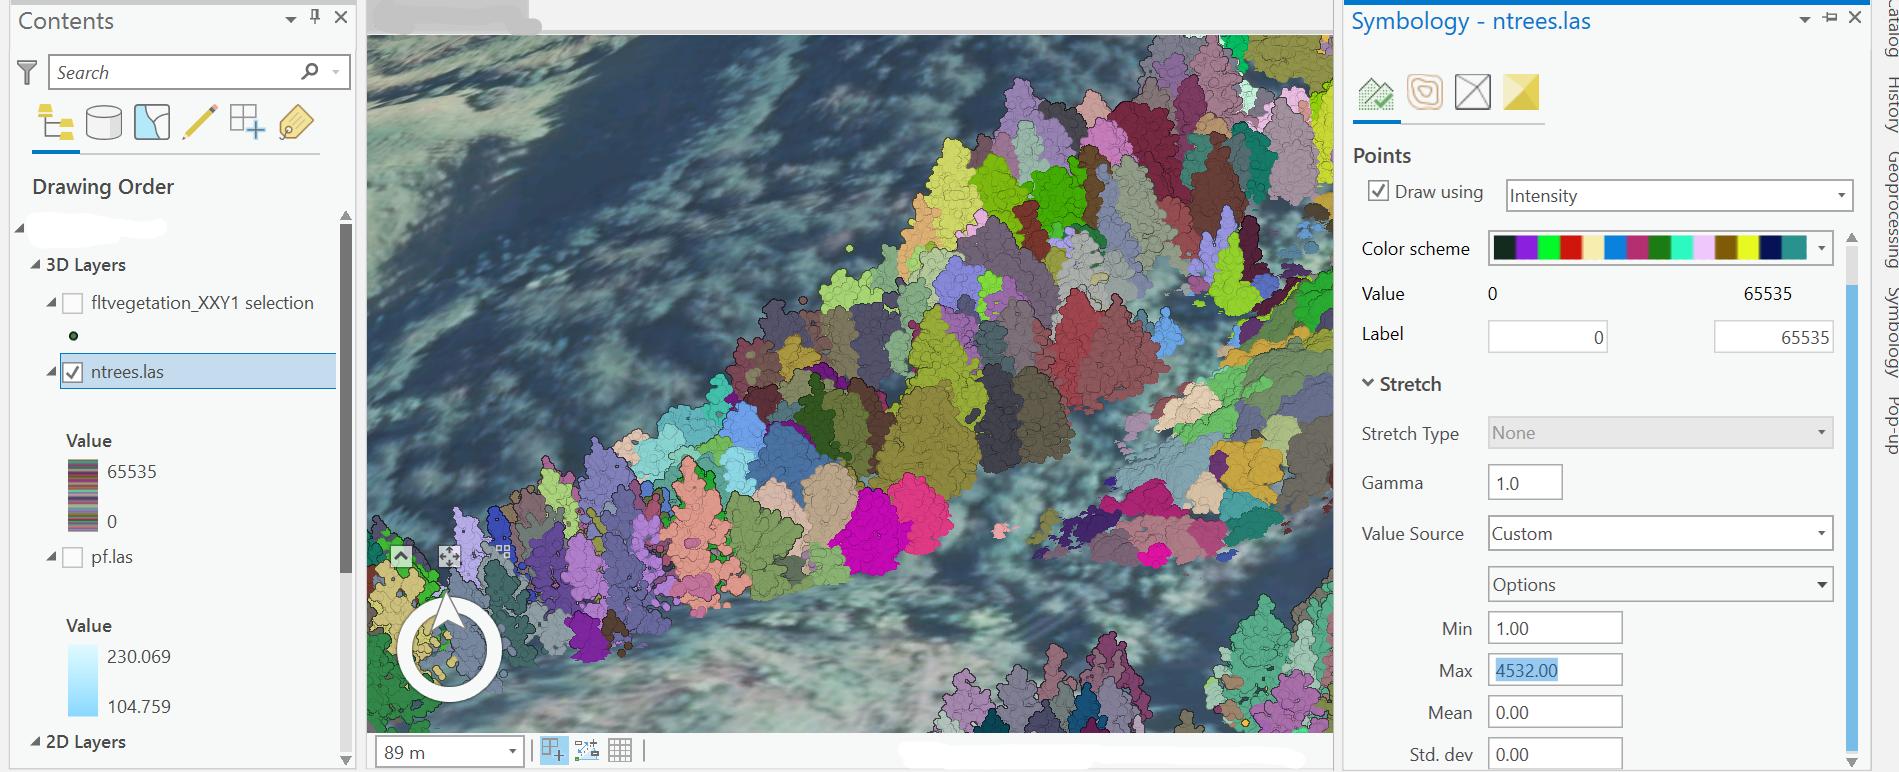
Screenshot of zoomed ArcPRO working with <65,535 treeID from the above code loading a larger .las fileScreenshot of zoomed ArcGIS Pro working with <65,535 treeID from the above code loading a larger .las file

The Intensity int column has the ability to store all the treeID values. There is a slightly different format for copying rows to another and you can find the locations using str(las1). Additionally, some NA values were discovered from points not allocated, which I have remedied below as this initially failed to enable writing the .las successfully. Once imported into ArcGIS Pro adjust the Symbology to draw using intensity creating a custom Value Source and random Color scheme setting your max number of of identified trees value as highlighted in the screenshot, this gave better visual results showing less adjacent trees being coloured similarly. The data clearly displays individual trees satisfactorily with some adjustment lowering the Symbol scale.

library(lidR)
library(dplyr)

# Import the las and segment the trees
LASfile <- system.file("extdata", "MixedConifer.laz", package="lidR")
las <- readLAS(LASfile)
las1 <- segment_trees(las, li2012())

# remove points that are not assigned to a tree
trees = filter_poi(las1, !is.na(treeID))  # remove NA
col <- random.colors(100)
plot(trees, color = "treeID", colorPalette = col)

# format for copying rows to overwrite 
las1$Intensity = las1$treeID 
head(trees)  # checking first few rows copied

trees = filter_poi(las1, !is.na(Intensity))  # remove all NA values from here too
writeLAS(las = trees, file = "ntrees.las")
max(trees$Intensity, na.rm = TRUE)  # check max number of identified trees 

Screenshot below of my zoomed ArcPRO working with less than 65,535 treeID (Intensity attribute is 16 bits) from the above code but loading a significantly larger.las file than the example, this consisted of 130 Mb or 30 million data points consisting of 4532 trees.
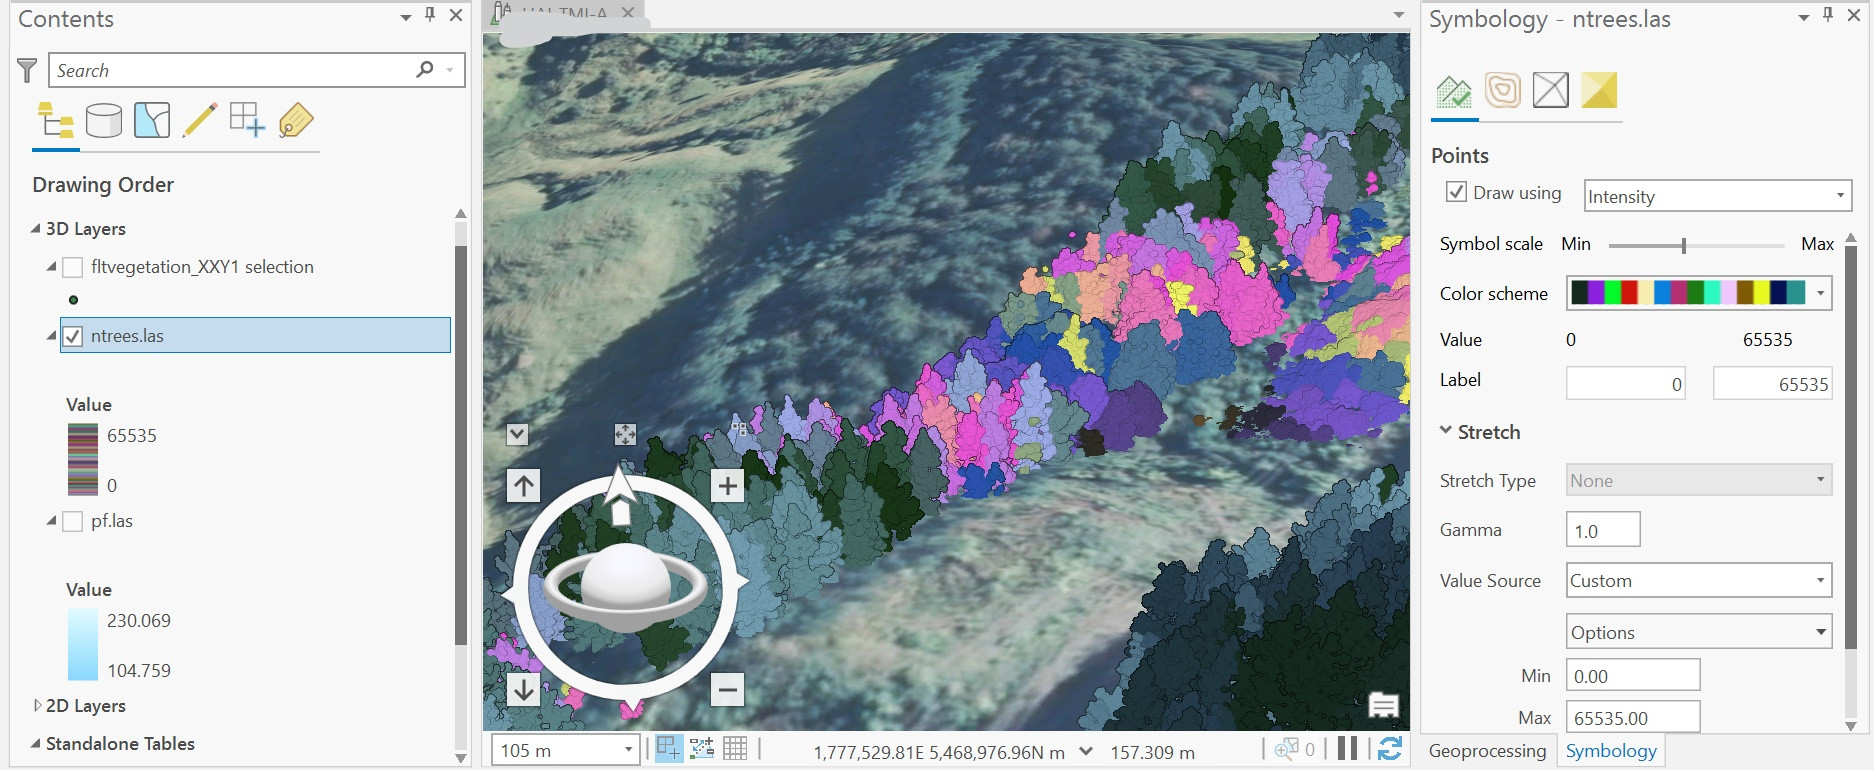
Screenshot of zoomed ArcPRO working with <65,535 treeID from the above code loading a larger .las file

The Intensity int column has the ability to store all the treeID values. There is a slightly different format for copying rows to another and you can find the locations using str(las1). Additionally, some NA values were discovered from points not allocated, which I have remedied below as this initially failed to enable writing the .las successfully. Once imported into ArcGIS Pro adjust the Symbology to draw using intensity creating a custom Value Source and random Color scheme setting your max number of of identified trees value as highlighted in the screenshot, this gave better visual results showing less adjacent trees being coloured similarly. The data clearly displays individual trees satisfactorily with some adjustment lowering the Symbol scale.

library(lidR)
library(dplyr)

# Import the las and segment the trees
LASfile <- system.file("extdata", "MixedConifer.laz", package="lidR")
las <- readLAS(LASfile)
las1 <- segment_trees(las, li2012())

# remove points that are not assigned to a tree
trees = filter_poi(las1, !is.na(treeID))  # remove NA
col <- random.colors(100)
plot(trees, color = "treeID", colorPalette = col)

# format for copying rows to overwrite 
las1$Intensity = las1$treeID 
head(trees)  # checking first few rows copied

trees = filter_poi(las1, !is.na(Intensity))  # remove all NA values from here too
writeLAS(las = trees, file = "ntrees.las")
max(trees$Intensity, na.rm = TRUE)  # check max number of identified trees 

Screenshot below of my zoomed ArcGIS Pro working with less than 65,535 treeID (Intensity attribute is 16 bits) from the above code but loading a significantly larger.las file than the example, this consisted of 130 Mb or 30 million data points consisting of 4532 trees.

Screenshot of zoomed ArcGIS Pro working with <65,535 treeID from the above code loading a larger .las file

added 4 characters in body
Source Link
PolyGeo
  • 65.4k
  • 29
  • 114
  • 345

The Intensity int column has the ability to store all the treeID values. There is a slightly different format for copying rows to another and you can find the locations using str(las1). Additionally, some NA values were discovered from points not allocated, which I have remedied below as this initially failed to enable writing the .las successfully. Once imported into ArcProArcGIS Pro adjust the Symbology to draw using intensity creating a custom Value Source and random Color scheme setting your max number of of identified trees value as highlighted in the screenshot, this gave better visual results showing less adjacent trees being coloured similarly. The data clearly displays individual trees satisfactorily with some adjustment lowering the Symbol scale.

library(lidR)
library(dplyr)

# Import the las and segment the trees
LASfile <- system.file("extdata", "MixedConifer.laz", package="lidR")
las <- readLAS(LASfile)
las1 <- segment_trees(las, li2012())

# remove points that are not assigned to a tree
trees = filter_poi(las1, !is.na(treeID))  # remove NA
col <- random.colors(100)
plot(trees, color = "treeID", colorPalette = col)

# format for copying rows to overwrite 
las1$Intensity = las1$treeID 
head(trees)  # checking first few rows copied

trees = filter_poi(las1, !is.na(Intensity))  # remove all NA values from here too
writeLAS(las = trees, file = "ntrees.las")
max(trees$Intensity, na.rm = TRUE)  # check max number of identified trees 

Screenshot below of my zoomed ArcPRO working with less than 65,535 treeID (Intensity attribute is 16 bits) from the above code but loading a significantly larger.las file than the example, this consisted of 130 Mb or 30 million data points consisting of 4532 trees.

Screenshot of zoomed ArcPRO working with <65,535 treeID from the above code loading a larger .las file

The Intensity int column has the ability to store all the treeID values. There is a slightly different format for copying rows to another and you can find the locations using str(las1). Additionally, some NA values were discovered from points not allocated, which I have remedied below as this initially failed to enable writing the .las successfully. Once imported into ArcPro adjust the Symbology to draw using intensity creating a custom Value Source and random Color scheme setting your max number of of identified trees value as highlighted in the screenshot, this gave better visual results showing less adjacent trees being coloured similarly. The data clearly displays individual trees satisfactorily with some adjustment lowering the Symbol scale.

library(lidR)
library(dplyr)

# Import the las and segment the trees
LASfile <- system.file("extdata", "MixedConifer.laz", package="lidR")
las <- readLAS(LASfile)
las1 <- segment_trees(las, li2012())

# remove points that are not assigned to a tree
trees = filter_poi(las1, !is.na(treeID))  # remove NA
col <- random.colors(100)
plot(trees, color = "treeID", colorPalette = col)

# format for copying rows to overwrite 
las1$Intensity = las1$treeID 
head(trees)  # checking first few rows copied

trees = filter_poi(las1, !is.na(Intensity))  # remove all NA values from here too
writeLAS(las = trees, file = "ntrees.las")
max(trees$Intensity, na.rm = TRUE)  # check max number of identified trees 

Screenshot below of my zoomed ArcPRO working with less than 65,535 treeID (Intensity attribute is 16 bits) from the above code but loading a significantly larger.las file than the example, this consisted of 130 Mb or 30 million data points consisting of 4532 trees.

Screenshot of zoomed ArcPRO working with <65,535 treeID from the above code loading a larger .las file

The Intensity int column has the ability to store all the treeID values. There is a slightly different format for copying rows to another and you can find the locations using str(las1). Additionally, some NA values were discovered from points not allocated, which I have remedied below as this initially failed to enable writing the .las successfully. Once imported into ArcGIS Pro adjust the Symbology to draw using intensity creating a custom Value Source and random Color scheme setting your max number of of identified trees value as highlighted in the screenshot, this gave better visual results showing less adjacent trees being coloured similarly. The data clearly displays individual trees satisfactorily with some adjustment lowering the Symbol scale.

library(lidR)
library(dplyr)

# Import the las and segment the trees
LASfile <- system.file("extdata", "MixedConifer.laz", package="lidR")
las <- readLAS(LASfile)
las1 <- segment_trees(las, li2012())

# remove points that are not assigned to a tree
trees = filter_poi(las1, !is.na(treeID))  # remove NA
col <- random.colors(100)
plot(trees, color = "treeID", colorPalette = col)

# format for copying rows to overwrite 
las1$Intensity = las1$treeID 
head(trees)  # checking first few rows copied

trees = filter_poi(las1, !is.na(Intensity))  # remove all NA values from here too
writeLAS(las = trees, file = "ntrees.las")
max(trees$Intensity, na.rm = TRUE)  # check max number of identified trees 

Screenshot below of my zoomed ArcPRO working with less than 65,535 treeID (Intensity attribute is 16 bits) from the above code but loading a significantly larger.las file than the example, this consisted of 130 Mb or 30 million data points consisting of 4532 trees.

Screenshot of zoomed ArcPRO working with <65,535 treeID from the above code loading a larger .las file

added tree count to code , redraw image and reclassify as the value for ntree.las is the maximum allocated allowance and not the tree counts
Source Link

The Intensity int column has the ability to store all the treeID values. There is a slightly different format for copying rows to another and you can find the locations using str(las1). Additionally, some NA values were discovered from points not allocated, which I have remedied below as this initially failed to enable writing the .las successfully. Once imported into ArcPro adjust the Symbology to draw using intensity creating a custom value sourceValue Source and random Color scheme setting your max number of of identified trees value as highlighted in the screenshot, this gave better visual results showing less adjacent trees being coloured similarly. The data clearly displays individual trees satisfactorily with some adjustment lowering the Symbol scale.

library(lidR)
library(dplyr)

# Import the las and segment the trees
LASfile <- system.file("extdata", "MixedConifer.laz", package="lidR")
las <- readLAS(LASfile)
las1 <- segment_trees(las, li2012())

# remove points that are not assigned to a tree
trees = filter_poi(las1, !is.na(treeID))  # remove NA
col <- random.colors(100)
plot(trees, color = "treeID", colorPalette = col)

# format for copying rows to overwrite 
las1$Intensity = las1$treeID 
head(trees)  # checking first few rows copied

trees = filter_poi(las1, !is.na(Intensity))  # remove all NA values from here too
writeLAS(las = trees, file = "ntrees.las")
max(trees$Intensity, na.rm = TRUE)  # check max number of identified trees 

Screenshot below of my zoomed ArcPRO working with less than 65,535 treeID (Intensity attribute is 16 bits) from the above code but loading a significantly larger.las file than the example, this consisted of 130 Mb or 30 million data points consisting of 4532 trees.

Screenshot of zoomed ArcPRO working with 65,000 treeID from the above code loading a larger .las fileScreenshot of zoomed ArcPRO working with <65,535 treeID from the above code loading a larger .las file

The Intensity int column has the ability to store all the treeID values. There is a slightly different format for copying rows to another and you can find the locations using str(las1). Additionally, some NA values were discovered from points not allocated, which I have remedied below as this initially failed to enable writing the .las successfully. Once imported into ArcPro adjust the Symbology to draw using intensity creating a custom value source and random Color scheme. The data clearly displays individual trees satisfactorily with some adjustment lowering the Symbol scale.

library(lidR)
library(dplyr)

# Import the las and segment the trees
LASfile <- system.file("extdata", "MixedConifer.laz", package="lidR")
las <- readLAS(LASfile)
las1 <- segment_trees(las, li2012())

# remove points that are not assigned to a tree
trees = filter_poi(las1, !is.na(treeID))  # remove NA
col <- random.colors(100)
plot(trees, color = "treeID", colorPalette = col)

# format for copying rows to overwrite 
las1$Intensity = las1$treeID 
head(trees)  # checking first few rows copied

trees = filter_poi(las1, !is.na(Intensity))  # remove all NA values from here too
writeLAS(las = trees, file = "ntrees.las")

Screenshot below of my zoomed ArcPRO working with less than 65,535 treeID (Intensity attribute is 16 bits) from the above code but loading a significantly larger.las file than the example, this consisted of 130 Mb or 30 million data points

Screenshot of zoomed ArcPRO working with 65,000 treeID from the above code loading a larger .las file

The Intensity int column has the ability to store all the treeID values. There is a slightly different format for copying rows to another and you can find the locations using str(las1). Additionally, some NA values were discovered from points not allocated, which I have remedied below as this initially failed to enable writing the .las successfully. Once imported into ArcPro adjust the Symbology to draw using intensity creating a custom Value Source and random Color scheme setting your max number of of identified trees value as highlighted in the screenshot, this gave better visual results showing less adjacent trees being coloured similarly. The data clearly displays individual trees satisfactorily with some adjustment lowering the Symbol scale.

library(lidR)
library(dplyr)

# Import the las and segment the trees
LASfile <- system.file("extdata", "MixedConifer.laz", package="lidR")
las <- readLAS(LASfile)
las1 <- segment_trees(las, li2012())

# remove points that are not assigned to a tree
trees = filter_poi(las1, !is.na(treeID))  # remove NA
col <- random.colors(100)
plot(trees, color = "treeID", colorPalette = col)

# format for copying rows to overwrite 
las1$Intensity = las1$treeID 
head(trees)  # checking first few rows copied

trees = filter_poi(las1, !is.na(Intensity))  # remove all NA values from here too
writeLAS(las = trees, file = "ntrees.las")
max(trees$Intensity, na.rm = TRUE)  # check max number of identified trees 

Screenshot below of my zoomed ArcPRO working with less than 65,535 treeID (Intensity attribute is 16 bits) from the above code but loading a significantly larger.las file than the example, this consisted of 130 Mb or 30 million data points consisting of 4532 trees.

Screenshot of zoomed ArcPRO working with <65,535 treeID from the above code loading a larger .las file

deleted 192 characters in body
Source Link
JRR
  • 9.7k
  • 1
  • 14
  • 29
Loading
tidy code and comments
Source Link
Loading
made answer clear
Source Link
Loading
made clearer what the screenshot image was
Source Link
Loading
Source Link
Loading