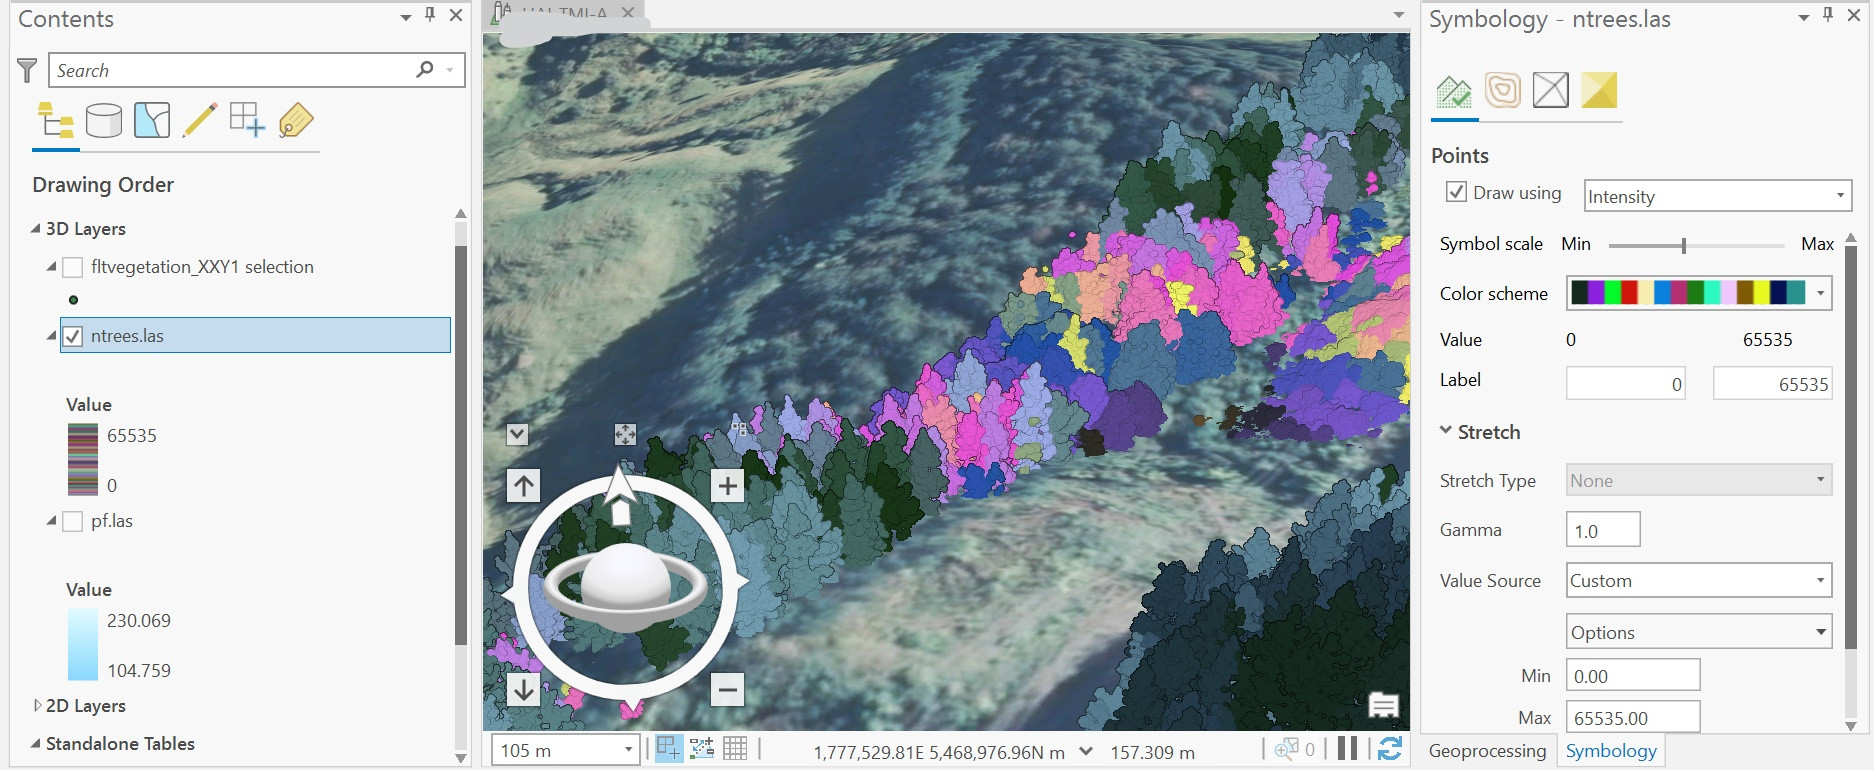
The Intensity int column has the ability to store all the treeID values. And successfully writes the .las file. Once imported into ArcPro adjusting the Symbology to draw using intensity creating a custom value source and random Color scheme for the data clearly displays individual trees satisfactorily with some adjustment lowering the Symbol scale. Additionally some NA values were discovered from points not allocated, which I have remedied below as this initially failed to enable writing the .las
library(lidR)
library(dplyr)
## TESTING SMALL FILE  #############################################################################
#  Import the las and segment the trees
LASfile <- system.file("extdata", "MixedConifer.laz", package="lidR")
#las <- readLAS(LASfile)
las <- readLAS(LASfile)
las1 <- segment_trees(las, li2012())
##################################################################################################
# remove points that are not assigned to a tree
trees = lasfilter(las1, !is.na(treeID))  #  remove NA
col <- random.colors(100)
plot(trees, color = "treeID", colorPalette = col)

las1@data$Intensity = las1@data$treeID  #  copy
head(trees1)  # checking first few rows copied

trees1 = lasfilter(las1, !is.na(Intensity))  # remove all NA values from here too
writeLAS(las = trees1, file = "ntrees.las")

#plot(las1, color = "treeID", colorPalette = col)
Screenshot below of my zoomed ArcPRO working with over 65,000 treeID from the above code but loading a significantly larger .las file than the example, this consisted of of 130mb or 30 million data points

