Tweeted twitter.com/StackGIS/status/1373741220258795524
readability
Source Link
Andre Silva
  • 10.3k
  • 12
  • 55
  • 109

I've been struggling with this for the past few days. I want to create a DEM of a flood control area, which is covered in low/intermediate-height vegetation (pioneers and reed mostly). The point cloud data with x,y,z y and z comes from airborne LiDAR and I've been able to load it into QGIS by conversion and translation and managed to create a DSM. 

From false-colored images, I know the locations where the vegetation is present. Is there a way to get an actual DEM of the area by removing the low/intermediate-vegetation? My aim is to obtain a DEM to analyze the flooding area, so an increase in the accuracy of the elevation data would be very useful.

Part of the headerless .txt file LidaR;LIDAR; so x coord, y-coord coord and z-coord coord / elevation;

147675.500 210500.500 10.15 ..etc Ln 1805277, Col 1 (Notepad)

147675.500 210500.500 10.15
etc Ln 1805277, Col 1 (Notepad)

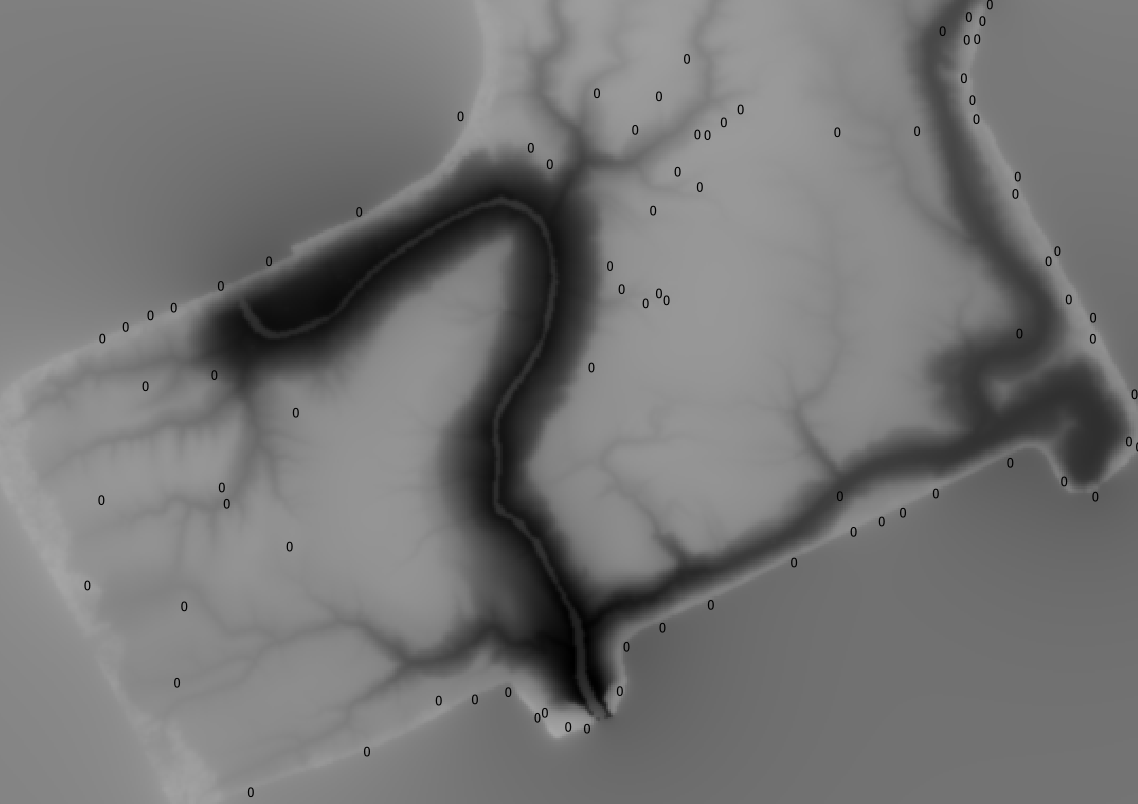
This is how the DTM looks after I've loaded the text file via Raster>Conversion>Translation and used a IDW-interpolation  :

enter image description here

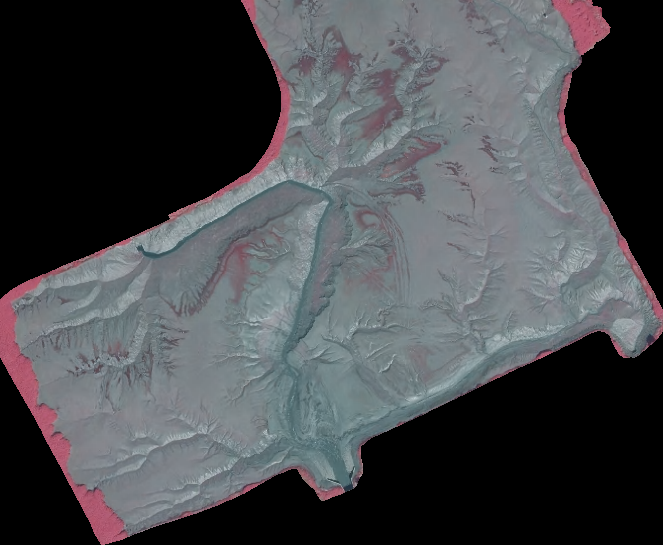
This is de CIR image from the area, showing the vegetation cover  :

enter image description here

I thought when using LASTools I cancould extract the bare ground, so first I've used txt2lastxt2las to convert the .txt file to a .las file. When running the lasinfolasinfo on this newly created .las file, this is what I get:

I use QGIS 3.16 and the LiDAR data I received is in headerless .txt format. I've tried LAStools and converted the LiDAR .txt into .las, but the las2demlas2dem is not giving an output file and says:

WARNING: unlicensed. over 1.5 million points. inserting black diagonal. 
ERROR: cannot find triangle in first 10000 points.

I've been struggling with this for the past few days. I want to create a DEM of a flood control area, which is covered in low/intermediate-height vegetation (pioneers and reed mostly). The point cloud data with x,y,z comes from airborne LiDAR and I've been able to load it into QGIS by conversion and translation and managed to create a DSM. From false-colored images, I know the locations where the vegetation is present. Is there a way to get an actual DEM of the area by removing the low/intermediate-vegetation? My aim is to obtain a DEM to analyze the flooding area, so an increase in the accuracy of the elevation data would be very useful.

Part of the headerless .txt file LidaR; so x coord, y-coord and z-coord / elevation;

147675.500 210500.500 10.15 ..etc Ln 1805277, Col 1 (Notepad)

This is how the DTM looks after I've loaded the text file via Raster>Conversion>Translation and used a IDW-interpolation  enter image description here

This is de CIR image from the area, showing the vegetation cover  enter image description here

I thought when using LASTools I can extract the bare ground, so first I've used txt2las to convert the .txt file to a .las file. When running the lasinfo on this newly created .las file, this is what I get:

I use QGIS 3.16 and the LiDAR data I received is in headerless .txt format. I've tried LAStools and converted the LiDAR .txt into .las, but the las2dem is not giving an output file and says

WARNING: unlicensed. over 1.5 million points. inserting black diagonal. ERROR: cannot find triangle in first 10000 points.
I've been struggling with this for the past few days. I want to create a DEM of a flood control area, which is covered in low/intermediate-height vegetation (pioneers and reed mostly). The point cloud data with x, y and z comes from airborne LiDAR and I've been able to load it into QGIS by conversion and translation and managed to create a DSM. 

From false-colored images, I know the locations where the vegetation is present. Is there a way to get an actual DEM of the area by removing the low/intermediate-vegetation? My aim is to obtain a DEM to analyze the flooding area, so an increase in the accuracy of the elevation data would be very useful.

Part of the headerless .txt file LIDAR; so x coord, y coord and z coord / elevation;

147675.500 210500.500 10.15
etc Ln 1805277, Col 1 (Notepad)

This is how the DTM looks after I've loaded the text file via Raster>Conversion>Translation and used a IDW-interpolation:

enter image description here

This is de CIR image from the area, showing the vegetation cover:

enter image description here

I thought when using LASTools I could extract the bare ground, so first I've used txt2las to convert the .txt file to a .las file. When running the lasinfo on this newly created .las file, this is what I get:

I use QGIS 3.16 and the LiDAR data I received is in headerless .txt format. I've tried LAStools and converted the LiDAR .txt into .las, but the las2dem is not giving an output file and says:

WARNING: unlicensed. over 1.5 million points. inserting black diagonal. 
ERROR: cannot find triangle in first 10000 points.
Added pictures and code
Source Link

Part of the headerless .txt file LidaR; so x coord, y-coord and z-coord / elevation;

147675.500 210500.500 10.15 ..etc Ln 1805277, Col 1 (Notepad)

This is how the DTM looks after I've loaded the text file via Raster>Conversion>Translation and used a IDW-interpolation enter image description here

This is de CIR image from the area, showing the vegetation cover enter image description here

I thought when using LASTools I can extract the bare ground, so first I've used txt2las to convert the .txt file to a .las file. When running the lasinfo on this newly created .las file, this is what I get:

reporting all LAS header entries: 
file signature: 'LASF' 
file source ID: 0 
global_encoding: 0 
project ID GUID data 1-4: 00000000-0000-0000-0000-000000000000 
version major.minor: 1.2 
system identifier: 'LAStools (c) by rapidlasso GmbH' 
generating software: 'txt2las (version 200101)' 
file creation day/year: 70/2021 
header size: 227 
offset to point data: 321 
number var. length records: 1 
point data format: 0 
point data record length: 20 
number of point records: 1805276 
number of points by return: 1805276 0 0 0 0 
scale factor x y z: 10 10 10 
offset x y z: 0 0 0 
min x y z: 147680 210500 -10 
max x y z: 150000 213000 20 
variable length header record 1 of 1: 
reserved 0 
user ID 'LASF_Projection' 
record ID 34735 
length after header 40 
description 'by LAStools of rapidlasso GmbH' 
GeoKeyDirectoryTag version 1.1.0 number of keys 4 
key 1024 tiff_tag_location 0 count 1 value_offset 1 - GTModelTypeGeoKey: ModelTypeProjected 
key 3072 tiff_tag_location 0 count 1 value_offset 31370 - ProjectedCSTypeGeoKey: Belge 1972 / Belgian Lambert 72 
key 3076 tiff_tag_location 0 count 1 value_offset 9001 - ProjLinearUnitsGeoKey: Linear_Meter 
key 4099 tiff_tag_location 0 count 1 value_offset 9001 - VerticalUnitsGeoKey: Linear_Meter 
reporting minimum and maximum for all LAS point record entries ... 
X 14768 15000 
Y 21050 21300 
Z -1 2 
intensity 0 0 
return_number 1 1 
number_of_returns 1 1 
edge_of_flight_line 0 0 
scan_direction_flag 0 0 
classification 0 0 
scan_angle_rank 0 0 
user_data 0 0 
point_source_ID 0 0 
number of first returns: 1805276 
number of intermediate returns: 0 
number of last returns: 1805276 
number of single returns: 1805276 
overview over number of returns of given pulse: 1805276 0 0 0 0 0 0 
histogram of classification of points: 
1805276 never classified (0) 

So none of the points is classified as anything.

I use QGIS 3.16 and the LiDAR data I received is in headerless .txt format. I've tried LAStools and converted the LiDAR .txt into .las, but the las2demlas2dem is not working somehow. Asgiving an output file and says

WARNING: unlicensed. over 1.5 million points. inserting black diagonal. ERROR: cannot find triangle in first 10000 points.

As you can probably tell, I'm very much a beginner in QGIS.

I use QGIS 3.16 and the LiDAR data I received is in headerless .txt format. I've tried LAStools and converted the LiDAR .txt into .las, but the las2dem is not working somehow. As you can probably tell, I'm very much a beginner in QGIS.

Part of the headerless .txt file LidaR; so x coord, y-coord and z-coord / elevation;

147675.500 210500.500 10.15 ..etc Ln 1805277, Col 1 (Notepad)

This is how the DTM looks after I've loaded the text file via Raster>Conversion>Translation and used a IDW-interpolation enter image description here

This is de CIR image from the area, showing the vegetation cover enter image description here

I thought when using LASTools I can extract the bare ground, so first I've used txt2las to convert the .txt file to a .las file. When running the lasinfo on this newly created .las file, this is what I get:

reporting all LAS header entries: 
file signature: 'LASF' 
file source ID: 0 
global_encoding: 0 
project ID GUID data 1-4: 00000000-0000-0000-0000-000000000000 
version major.minor: 1.2 
system identifier: 'LAStools (c) by rapidlasso GmbH' 
generating software: 'txt2las (version 200101)' 
file creation day/year: 70/2021 
header size: 227 
offset to point data: 321 
number var. length records: 1 
point data format: 0 
point data record length: 20 
number of point records: 1805276 
number of points by return: 1805276 0 0 0 0 
scale factor x y z: 10 10 10 
offset x y z: 0 0 0 
min x y z: 147680 210500 -10 
max x y z: 150000 213000 20 
variable length header record 1 of 1: 
reserved 0 
user ID 'LASF_Projection' 
record ID 34735 
length after header 40 
description 'by LAStools of rapidlasso GmbH' 
GeoKeyDirectoryTag version 1.1.0 number of keys 4 
key 1024 tiff_tag_location 0 count 1 value_offset 1 - GTModelTypeGeoKey: ModelTypeProjected 
key 3072 tiff_tag_location 0 count 1 value_offset 31370 - ProjectedCSTypeGeoKey: Belge 1972 / Belgian Lambert 72 
key 3076 tiff_tag_location 0 count 1 value_offset 9001 - ProjLinearUnitsGeoKey: Linear_Meter 
key 4099 tiff_tag_location 0 count 1 value_offset 9001 - VerticalUnitsGeoKey: Linear_Meter 
reporting minimum and maximum for all LAS point record entries ... 
X 14768 15000 
Y 21050 21300 
Z -1 2 
intensity 0 0 
return_number 1 1 
number_of_returns 1 1 
edge_of_flight_line 0 0 
scan_direction_flag 0 0 
classification 0 0 
scan_angle_rank 0 0 
user_data 0 0 
point_source_ID 0 0 
number of first returns: 1805276 
number of intermediate returns: 0 
number of last returns: 1805276 
number of single returns: 1805276 
overview over number of returns of given pulse: 1805276 0 0 0 0 0 0 
histogram of classification of points: 
1805276 never classified (0) 

So none of the points is classified as anything.

I use QGIS 3.16 and the LiDAR data I received is in headerless .txt format. I've tried LAStools and converted the LiDAR .txt into .las, but the las2dem is not giving an output file and says

WARNING: unlicensed. over 1.5 million points. inserting black diagonal. ERROR: cannot find triangle in first 10000 points.

As you can probably tell, I'm very much a beginner in QGIS.

removed appreciation
Source Link
Vince
  • 20.3k
  • 16
  • 48
  • 65

I've been struggling with this for the past few days. I want to create a DEM of a flood control area, which is covered in low/intermediate-height vegetation (pioneers and reed mostly). The point cloud data with x,y,z comes from airborne LiDAR and I've been able to load it into QGIS by conversion and translation and managed to create a DSM. From false-colored images, I know the locations where the vegetation is present. Is there a way to get an actual DEM of the area by removing the low/intermediate-vegetation? My aim is to obtain a DEM to analyze the flooding area, so an increase in the accuracy of the elevation data would be very useful.

I use QGIS 3.16 and the LiDAR data I received is in headerless .txt format. I've tried LAStools and converted the LiDAR .txt into .las, but the las2dem is not working somehow. As you can probably tell, I'm very much a beginner in QGIS. Any help would be greatly appreciated!

I've been struggling with this for the past few days. I want to create a DEM of a flood control area, which is covered in low/intermediate-height vegetation (pioneers and reed mostly). The point cloud data with x,y,z comes from airborne LiDAR and I've been able to load it into QGIS by conversion and translation and managed to create a DSM. From false-colored images, I know the locations where the vegetation is present. Is there a way to get an actual DEM of the area by removing the low/intermediate-vegetation? My aim is to obtain a DEM to analyze the flooding area, so an increase in the accuracy of the elevation data would be very useful.

I use QGIS 3.16 and the LiDAR data I received is in headerless .txt format. I've tried LAStools and converted the LiDAR .txt into .las, but the las2dem is not working somehow. As you can probably tell, I'm very much a beginner in QGIS.

Source Link
Loading