Hello GIS stack exchange community,
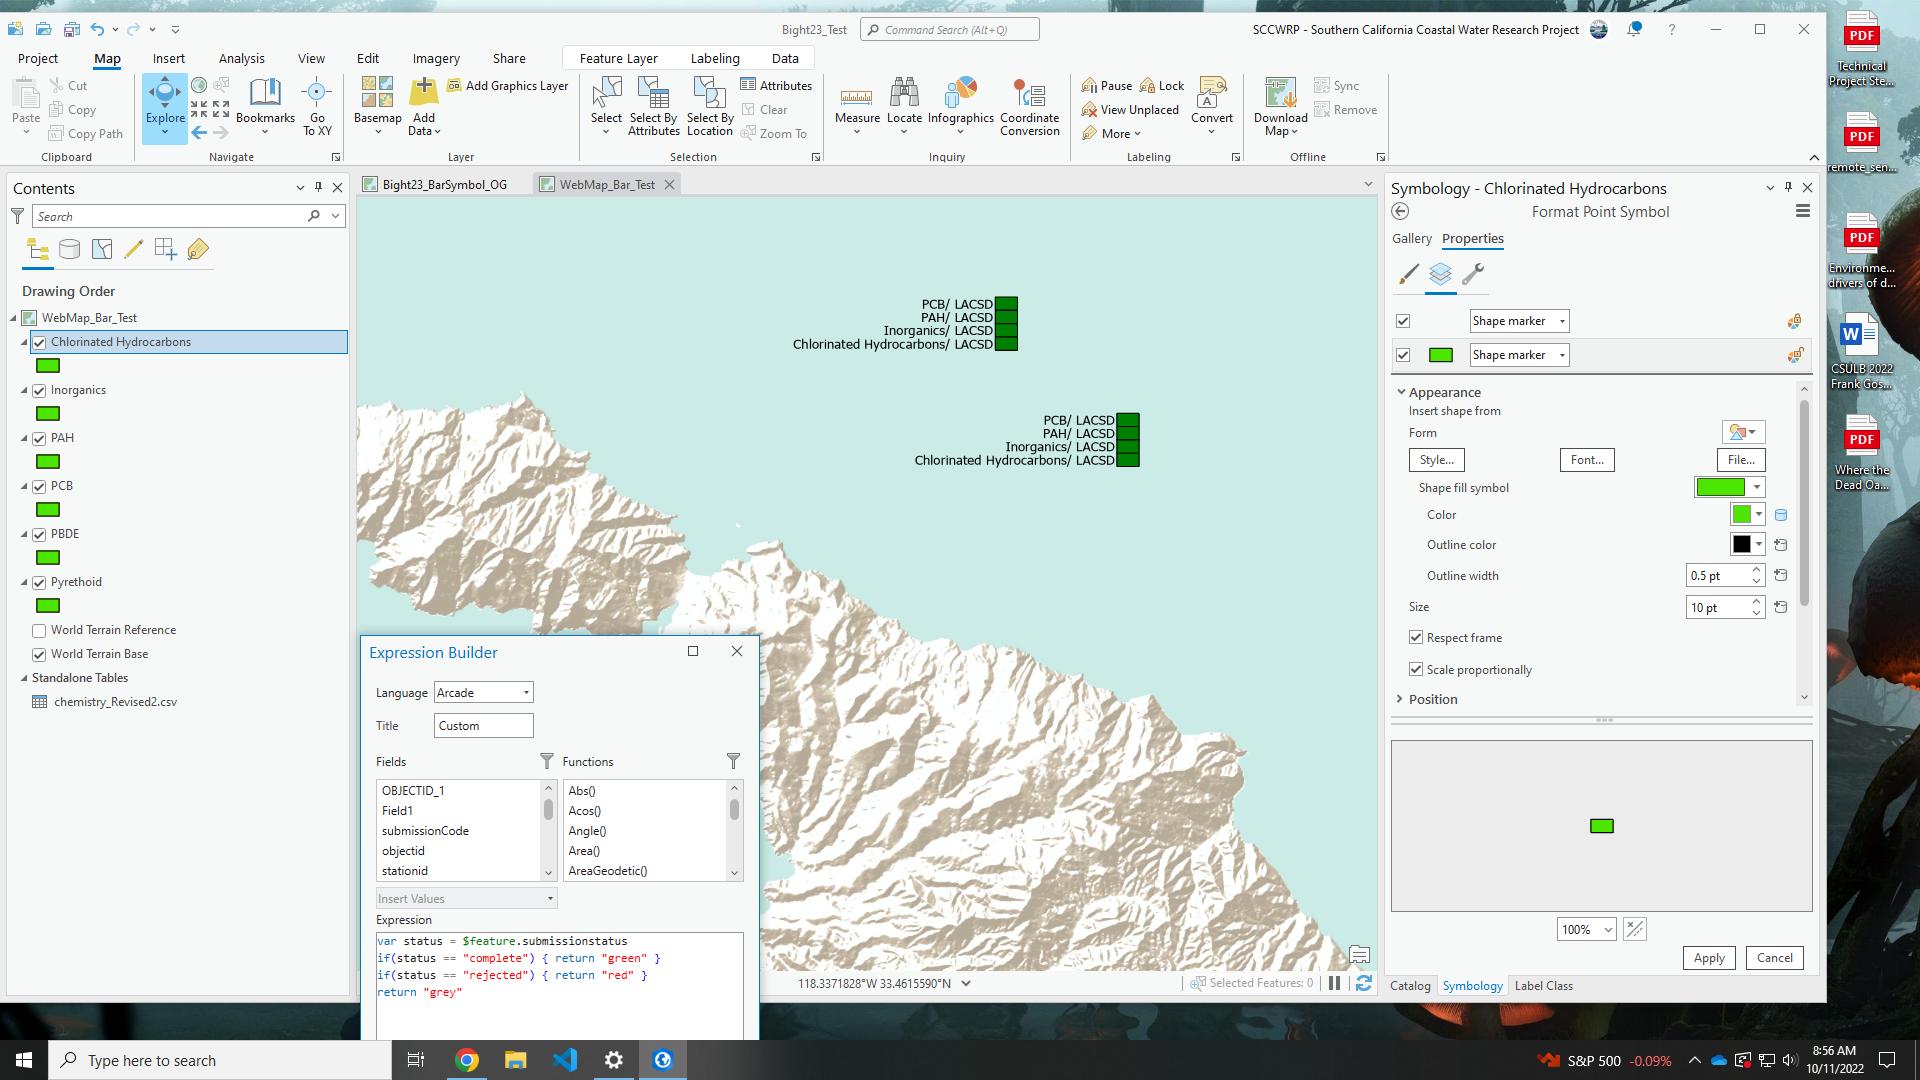
I'm trying to create a web map that highlights chemistry sampling data for my organization. Each station point has several "chemistry parameters" that needs to be displayed in a "bar chart" format.
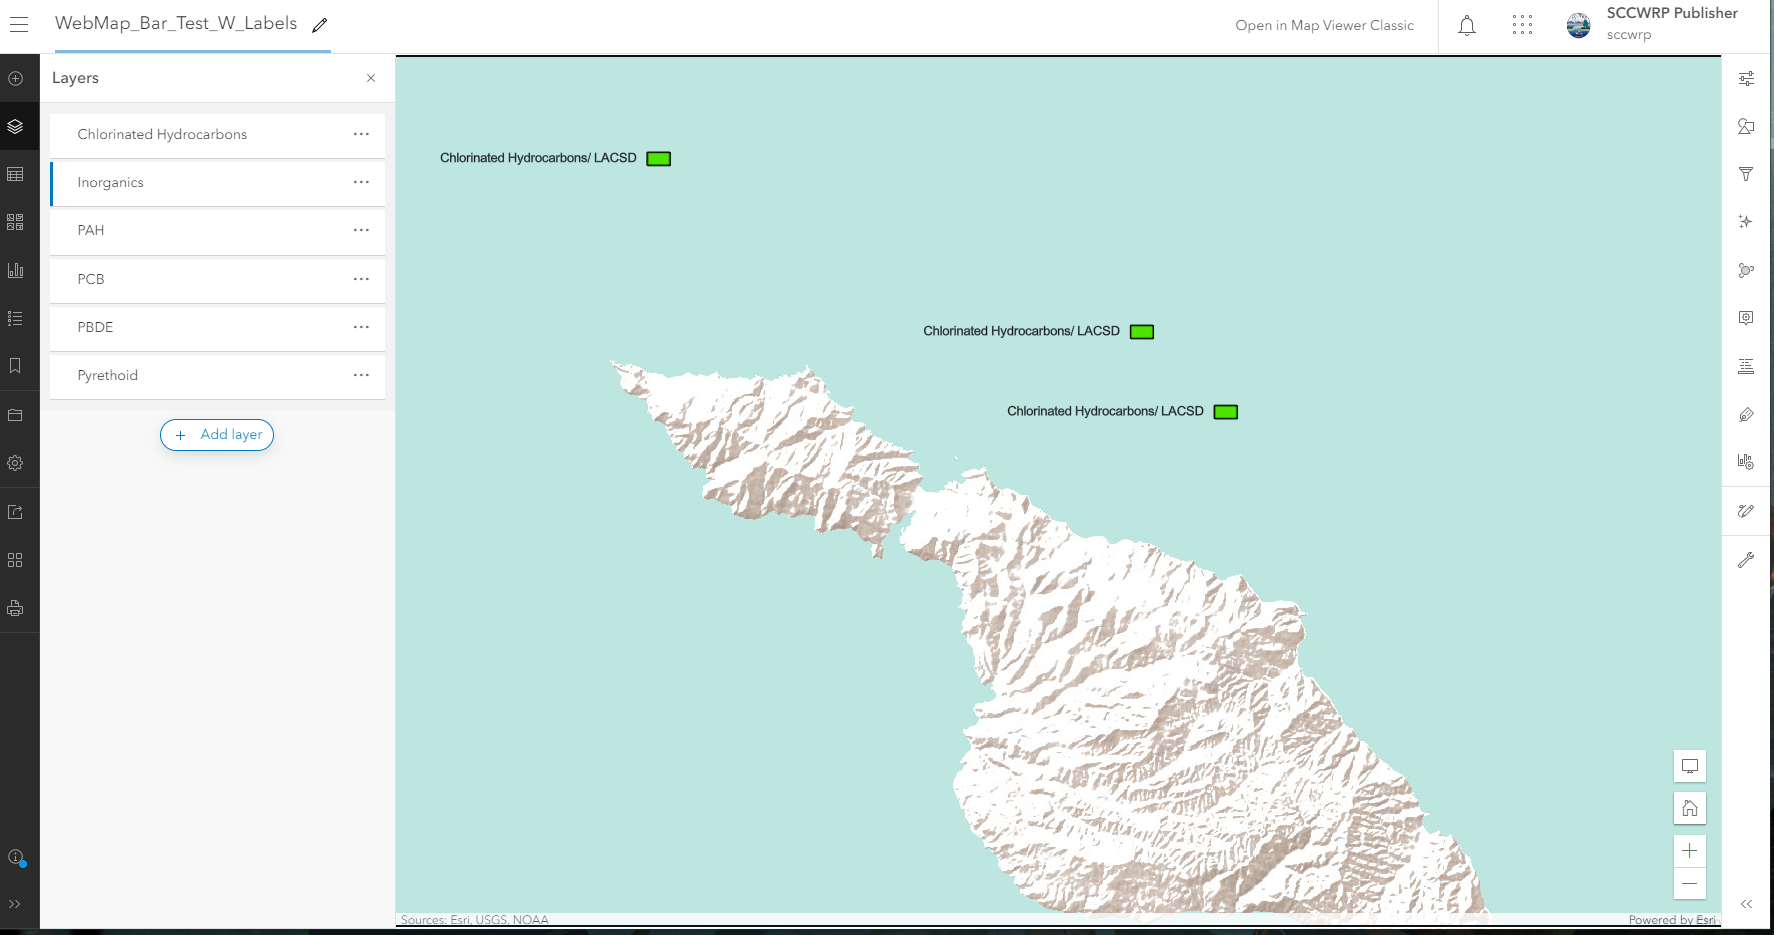
The issue I'm running into is that the arcadeArcade expression I used in ArcProArcGIS Pro where I created this map is not being honored once it's shared as a web map.
My question is, isIs there a process / workflow to include an arcadeArcade expression for modifying symbology?
I just want to understand how to best approach this.
Attached is the data table I'm working with, a screenshot of my webmap, and a screenshot of the ArcProArcGIS Pro symbology that I would like to re-create for the web map. The arcadeArcade expression that worked on ArcProArcGIS Pro was this (using the symbol property connections)...
var offsets = {
        "Chlorinated Hydrocarbons": 0,
        "Inorganics": -10,
        "PAH": -20,
        "PCB": -30,
        "PBDE": -40,
        "Pyrethroid": -50,
        // and so on
    }
    return offsets[$feature.parameter]


