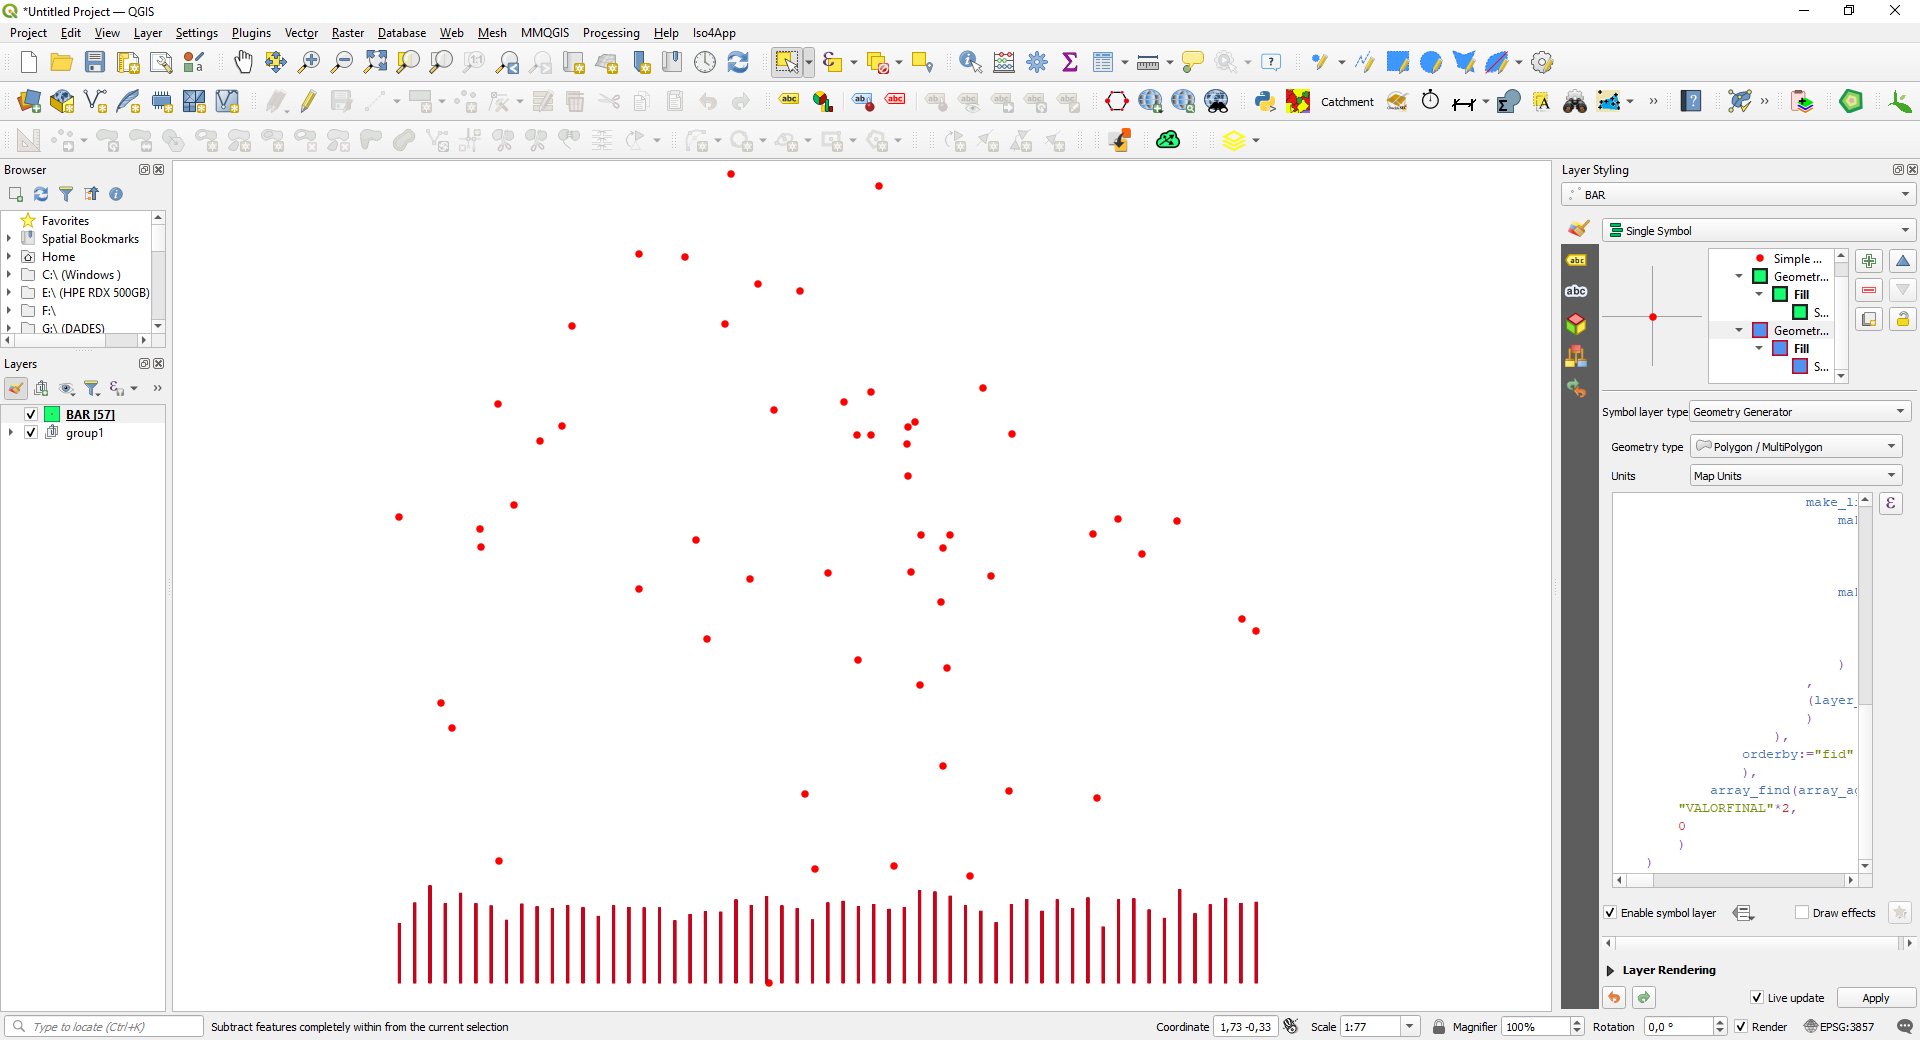
Related to the question Creating bar chart from point layer using QGIS Geometry Generator, I am using with success the expressionexpressions proposed by user Taras (https://gis.stackexchange.com/users/99589/tarasTaras) in Solution 2: and for user Babel.
make_line(
    geometry_n(
            order_parts(
                nodes_to_points(
                    densify_by_count(
                        make_line(
                            make_point(
                                    x_min(layer_property(@layer, 'extent')),
                                    y_min(layer_property(@layer, 'extent'))
                                    ),
                            make_point(
                                    x_max(layer_property(@layer, 'extent')),
                                    y_min(layer_property(@layer, 'extent'))
                                    )
                            )
                        ,
                        (layer_property(@layer, 'feature_count') - 2)
                        )
                    ),
                orderby:="month"
                ),
            array_find(array_agg($id, order_by:="month"), $id) + 1),
    project(
        geometry_n(
            order_parts(
                nodes_to_points(
                    densify_by_count(
                        make_line(
                            make_point(
                                    x_min(layer_property(@layer, 'extent')),
                                    y_min(layer_property(@layer, 'extent'))
                                    ),
                            make_point(
                                    x_max(layer_property(@layer, 'extent')),
                                    y_min(layer_property(@layer, 'extent'))
                                    )
                            )
                        ,
                        (layer_property(@layer, 'feature_count') - 2)
                        )
                    ),
                orderby:="month"
                ),
            array_find(array_agg($id, order_by:="month"), $id) + 1),
        "temp",
        0
        )
    )
The two proposed solutions are working well, but I am confronted the same problem in both solutions.
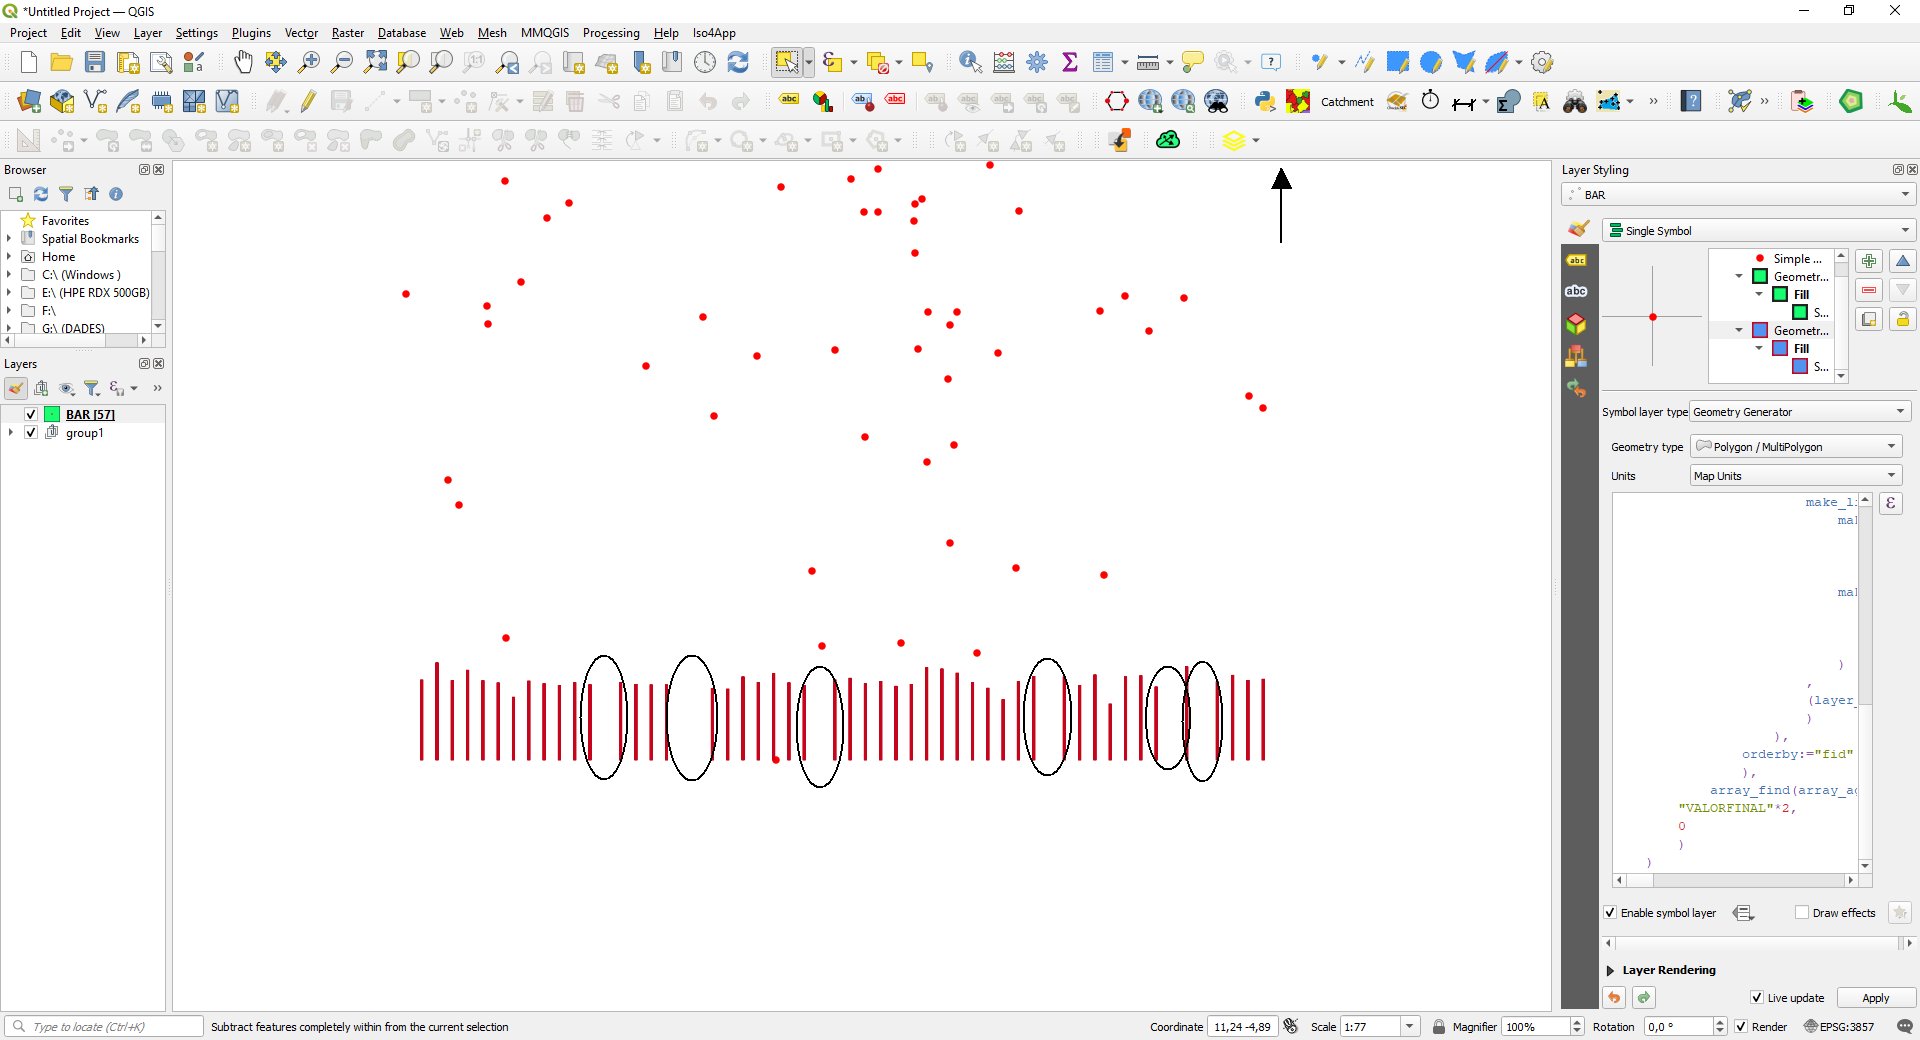
However, if I scrollpan the map up (or any other direction) and hide some points (outside the map view extent), the graph is incomplete (some bars disappear):
I understand the cause of this effect, but is there a solution to prevent this? In other words, is it possible that the result of the Geometry Generator expression is kept in the view even if its original point object is outside the view extent?


