deleted 66 characters in body
Source Link

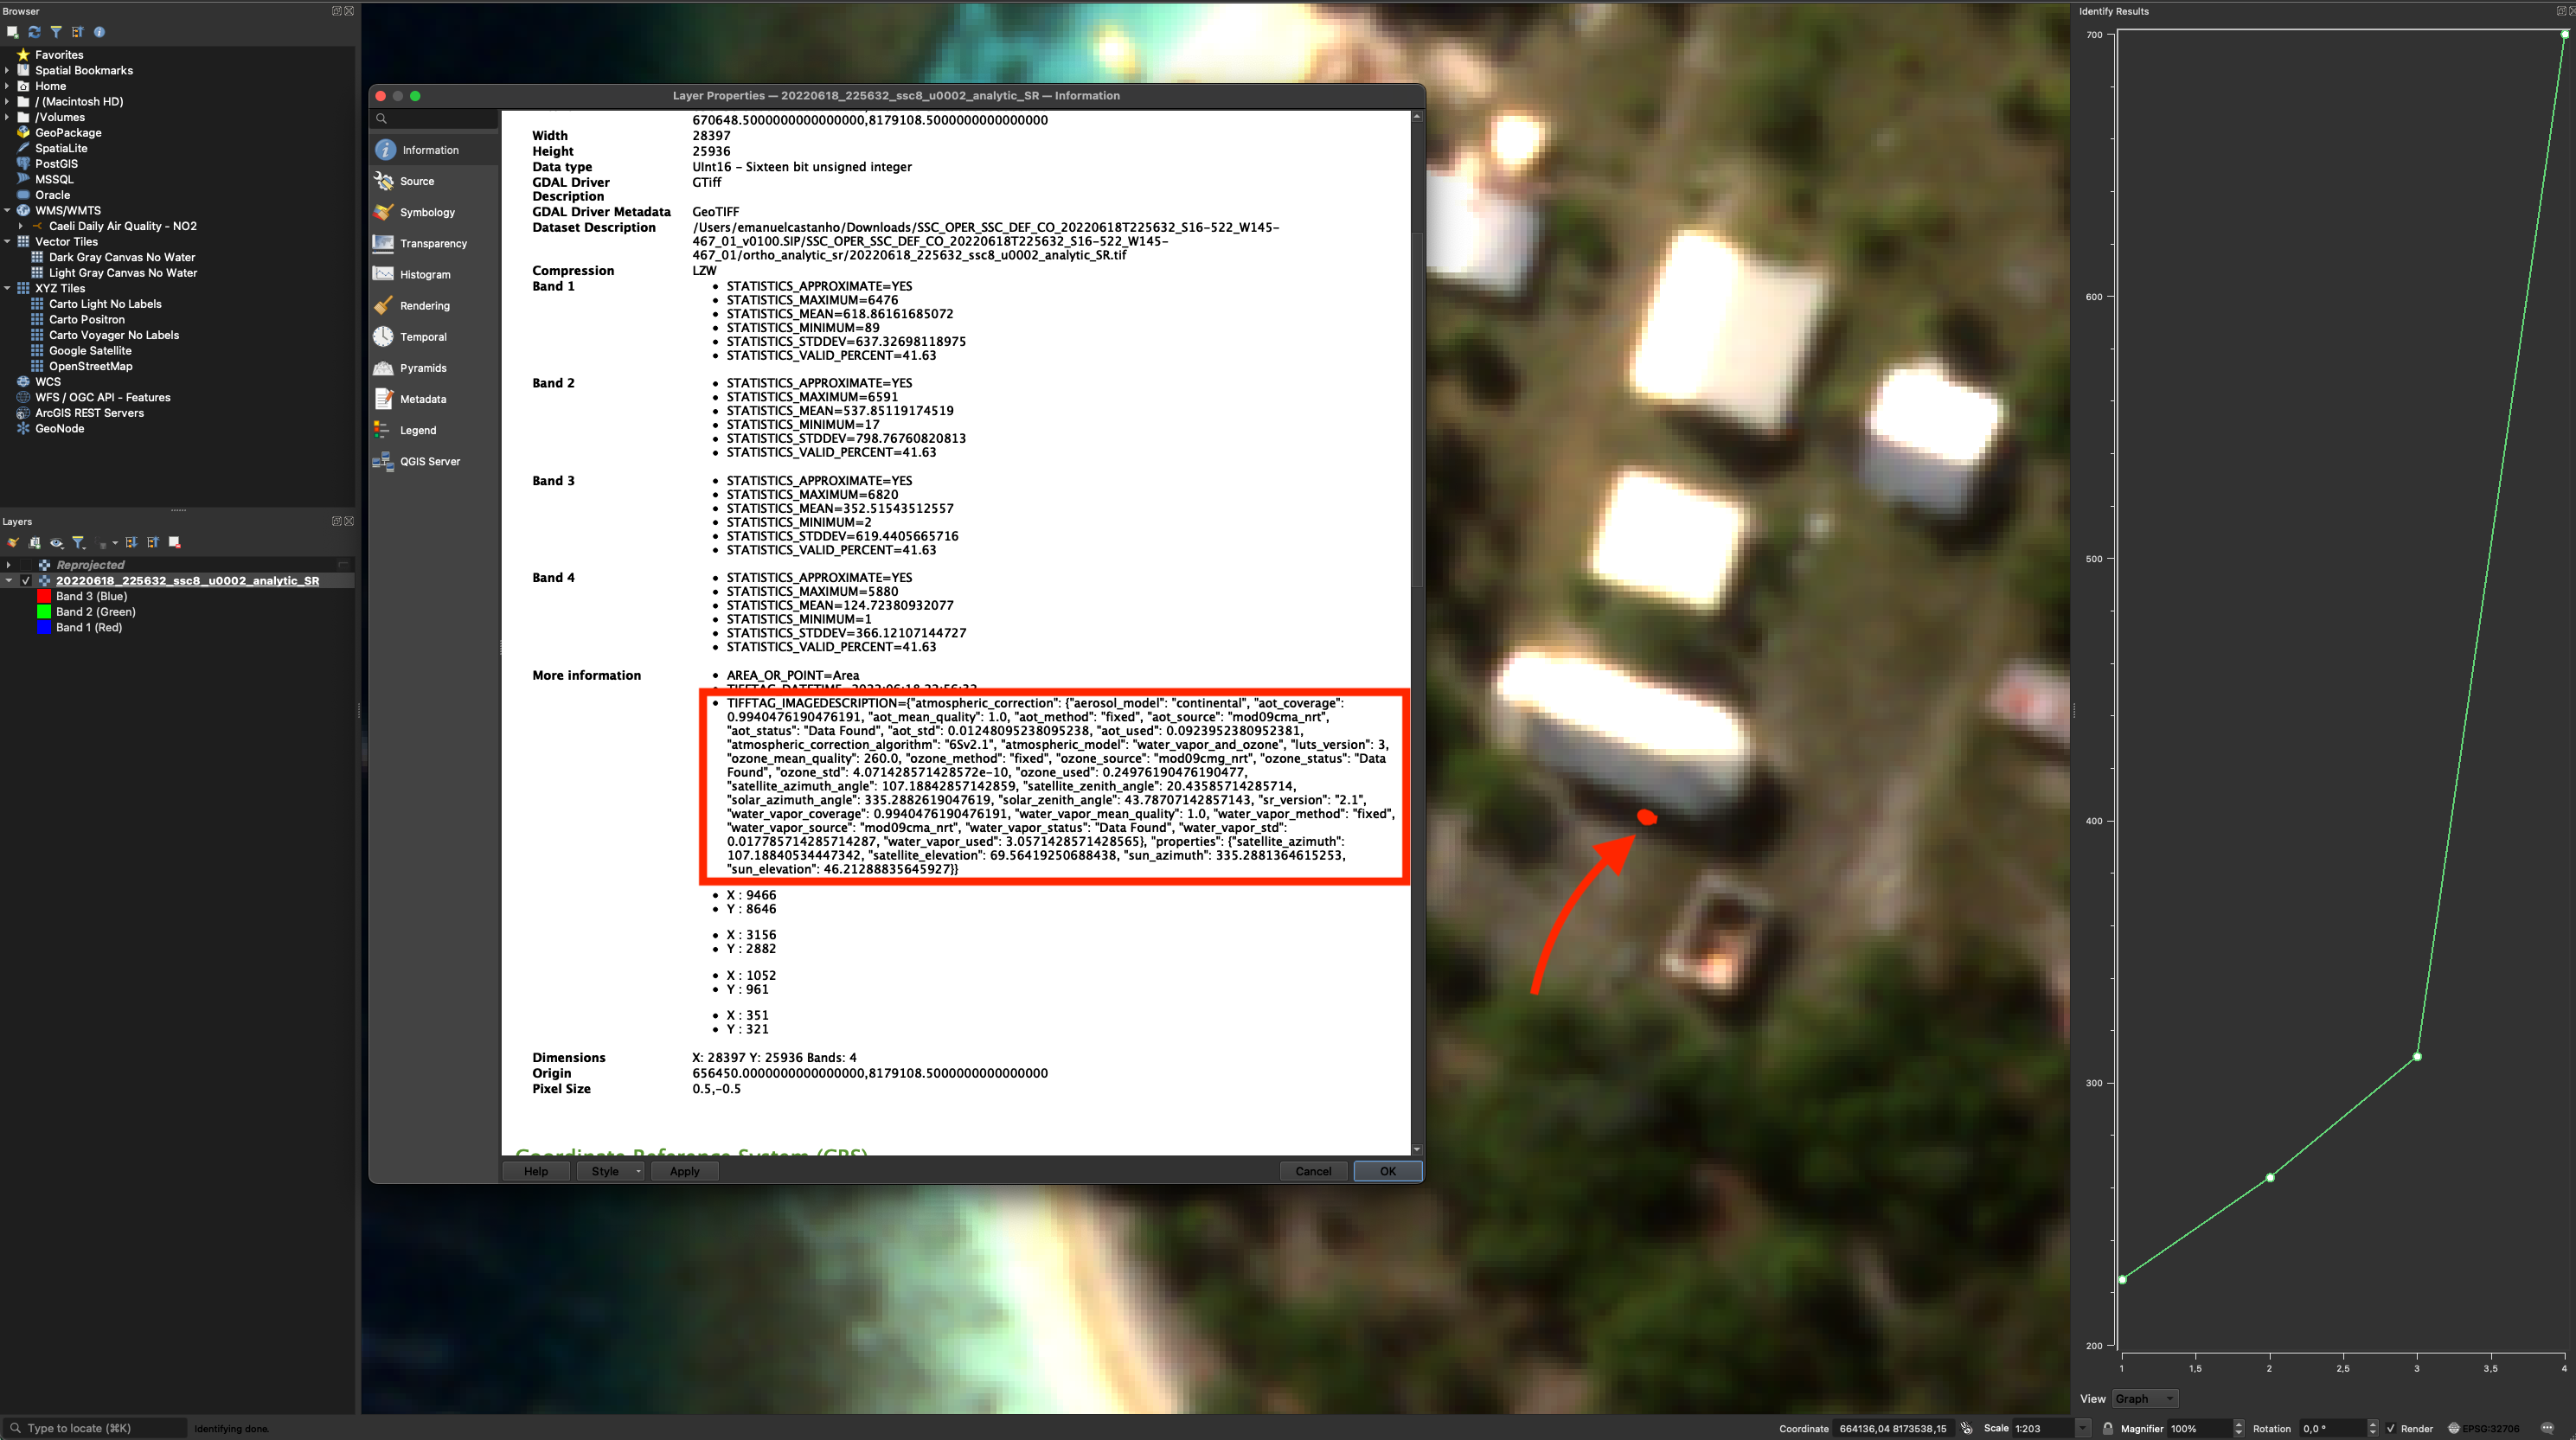
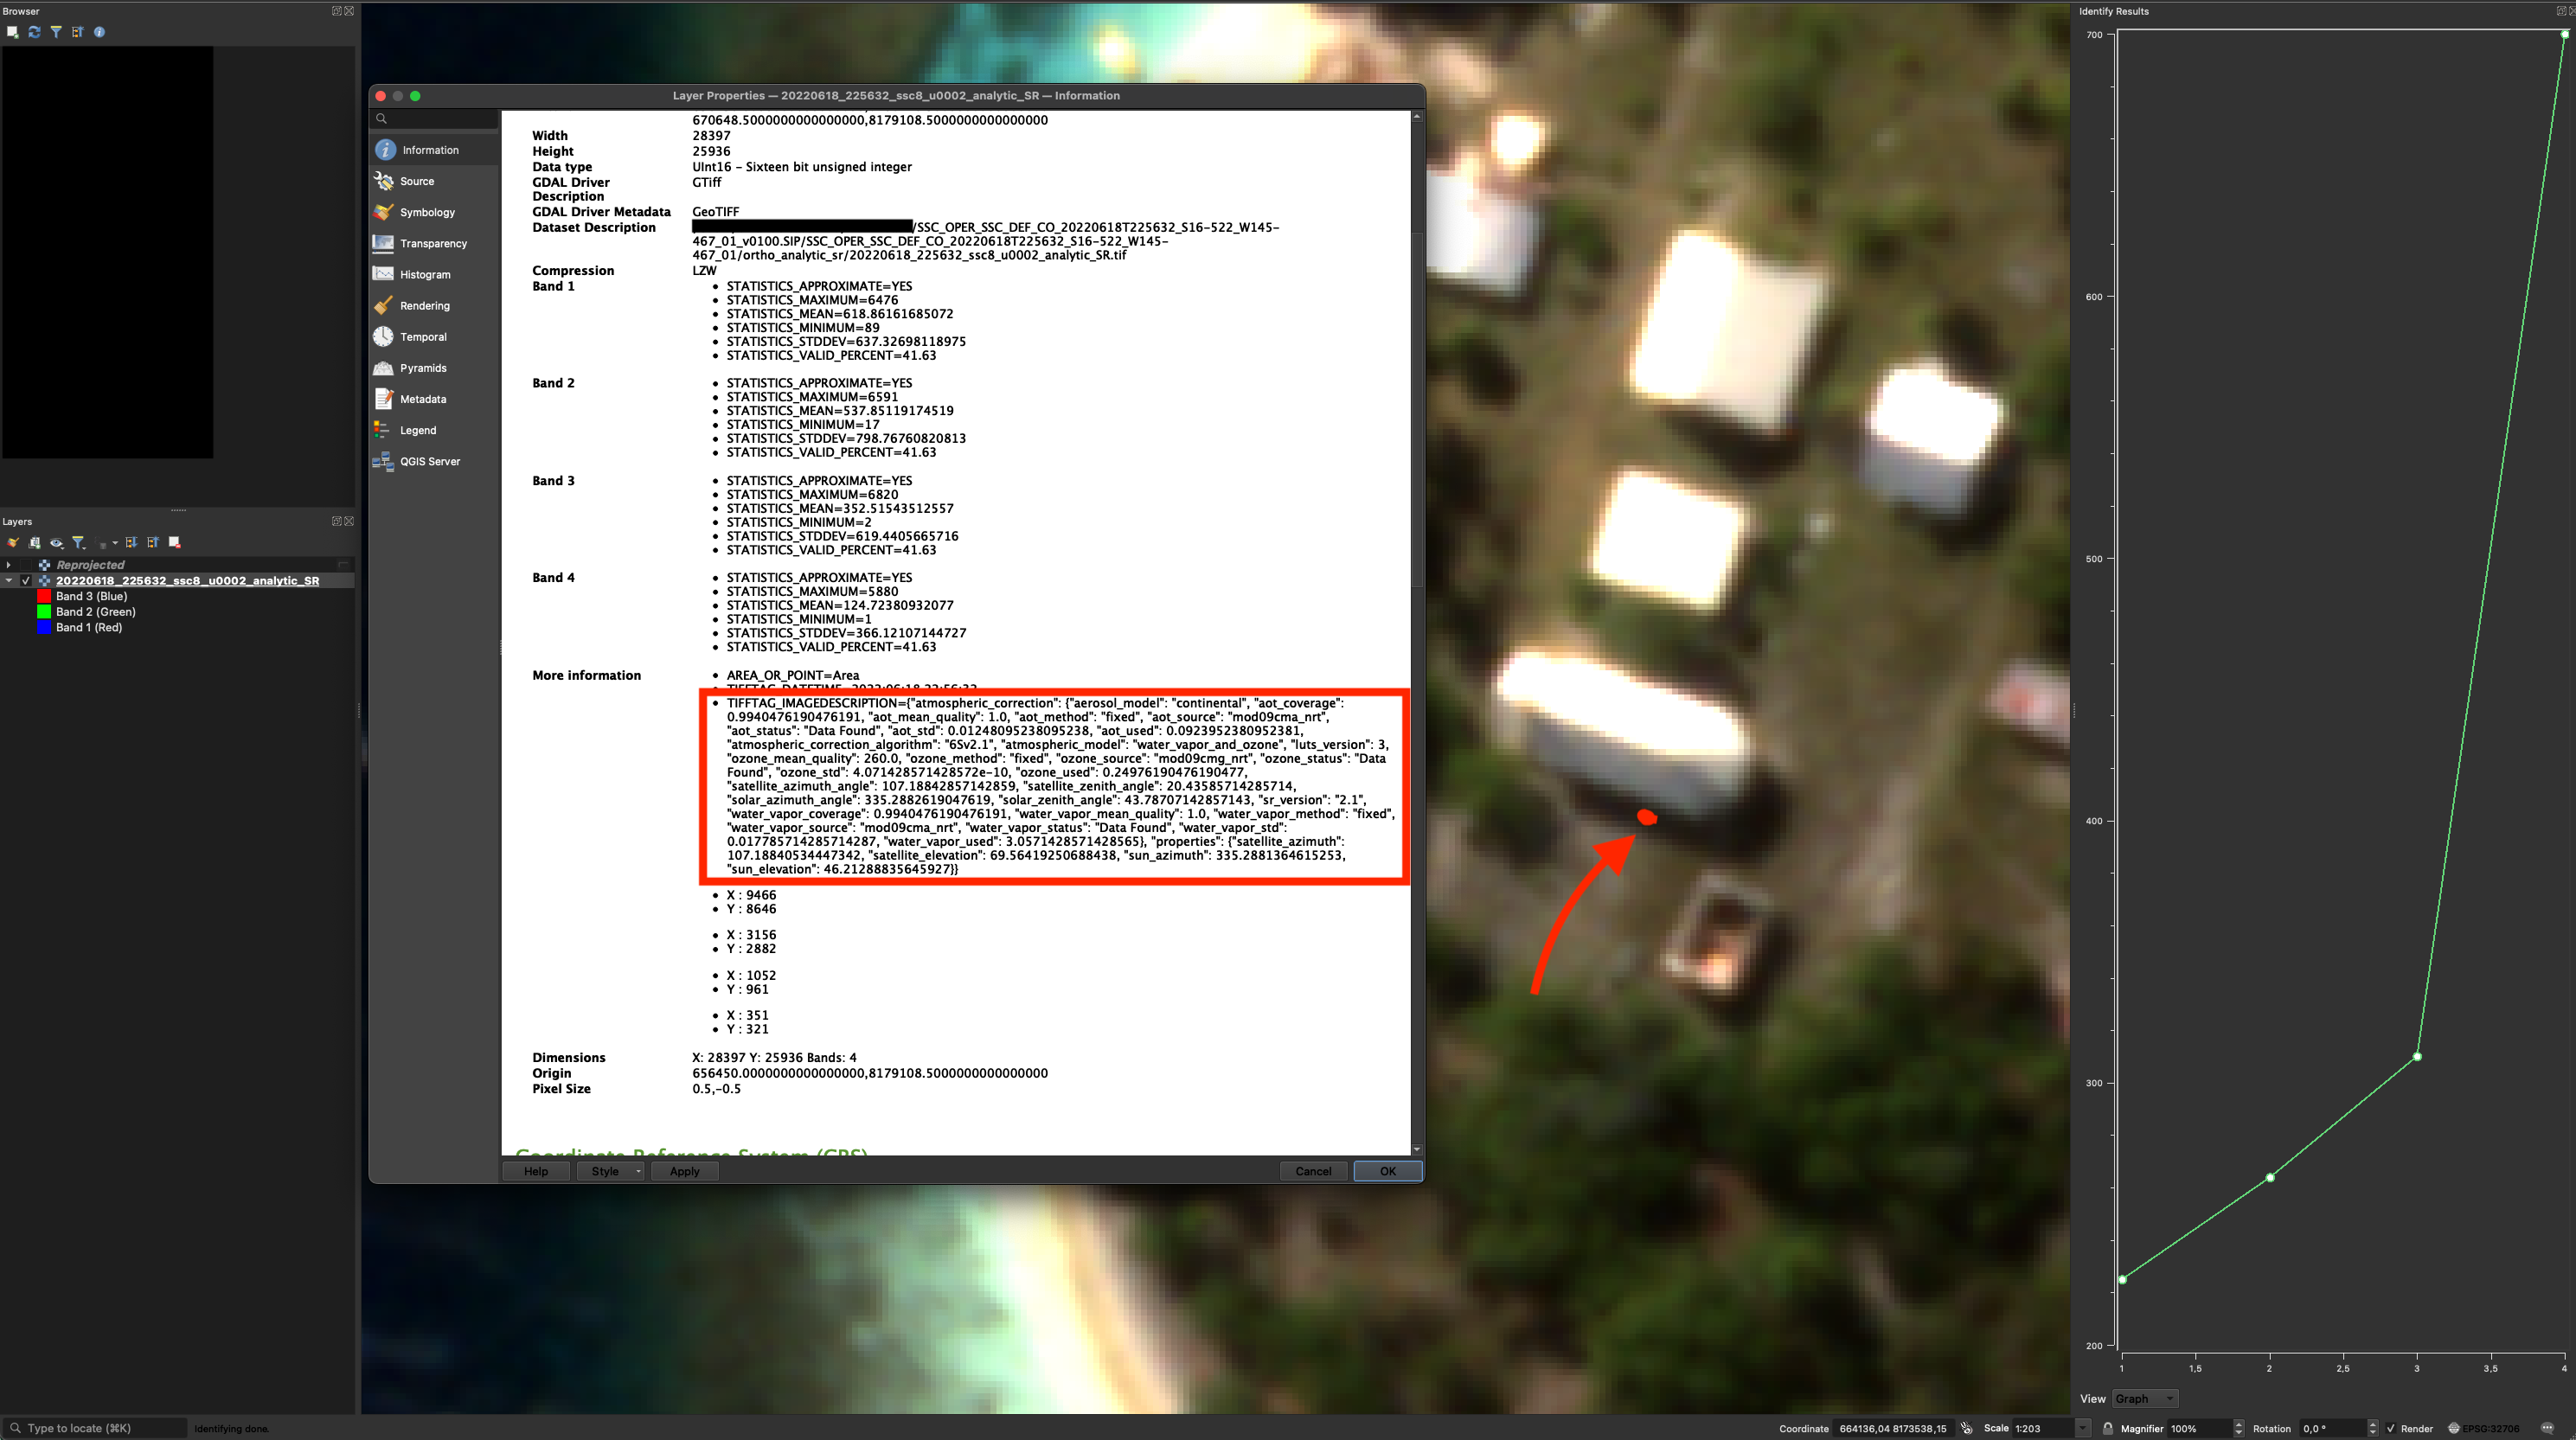
I was just checking a SkysatSkySat product from ESA Archive and here is an example of a shadow spectral signature (right plot) for a building shadow (red arrow and dot). You have the atmospheric correction information if you open in QGIS (red square). By the way, how do you convert the SR values? What are the offset and quantification values?

enter image description hereenter image description here

I was just checking a Skysat product from ESA Archive and here is an example of a shadow spectral signature (red arrow and dot). You have the atmospheric correction information if you open in QGIS (red square). By the way, how do you convert the SR values? What are the offset and quantification values?
enter image description here

I was just checking a SkySat product from ESA Archive and here is an example of a spectral signature (right plot) for a building shadow (red arrow and dot). You have the atmospheric correction information if you open in QGIS (red square).

enter image description here

Source Link

I was just checking a Skysat product from ESA Archive and here is an example of a shadow spectral signature (red arrow and dot). You have the atmospheric correction information if you open in QGIS (red square). By the way, how do you convert the SR values? What are the offset and quantification values?

enter image description here