12

I've got a database containing languages, their longitudes and latitudes and a feature value (either category 1, category 2 or both - in the plot these are marked red, blue and green respectively). There may be up to three points per language and naturally two language points may lie very close to each other.

    name            longitude   latitude    sp_sum
1   Modern Armenian 45          40          both
2   Modern Armenian 45          40          both
3   Modern Armenian 45          40          spatial
4   Dieri           138         -28.1667    both
5   Dieri           138         -28.1667    both
6   Finnish         25.5577     64.7628     non-spatial
7   Crimean Tatar   28.1418     43.8398     spatial
8   Ese Ejja        -67.515     -11.7268    non-spatial
9   Makhuwa         38.8052     -14.8509    non-spatial
...

I'm using the R package ggplot2 (that is the one I am most familiar with, so I'd be happy to keep using it - but other solutions are also welcome). Here's a crop from a previous attempt (code: see below 1):
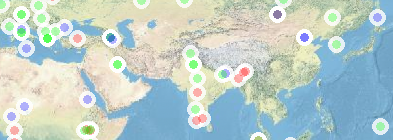
Crop from previous attempt

For every point, I'd like the (rough) position - as well as the value - still to be visible. (If there are multiple points for a single language, they may be combined.)

Is there a way either...

  • ... to move points to the side just enough so that there is no overplotting (less randomly than, say, by using geom_jitter - there is a lot of that kind of dodging in the beeswarm package for example)?
  • ... and/or to have some kind of "line" pointing to the original position of a point if it had to be moved?
  • ... or to combine close-by points in a way that they are still clear (there is probably a working technique out there that uses binning, i.e. stat_bin* or something with a similar effect)?
  • ... or to create an "interactive plot" like those seen on websites that still can be included into a pdf (I'm thinking also about the abilities of packages like animation and shiny here)? For example, it looks like this on wals.info:
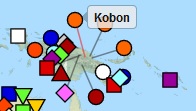
    wals

From a previous post here, I know that the directlabels package can move labels, but I haven't found a way to make it move the points as well.

Feel free to ask for clarification!

Note: I am aware that there have been a number of questions on overplotting, but those that I have looked into all seemed to be have a different (i.e. statistic) purpose (I don't claim to have read it all, so I'd be happy to accept a link as well, of course). I'll try to list those posts that I know and that may well be relevant (- from what I've read, none of these exactly answers my question.)


1 The following lines of code created the crop from above.

library(OpenStreetMap)
library(ggplot2)

data <- read.csv(header = T, sep = ",", dec = ".", quote= "'",
text = "'','name','longitude','latitude','sp_sum'
'1','Modern Armenian',45,40,'both'
'2','Modern Armenian',45,40,'both'
'3','Modern Armenian',45,40,'spatial'
'4','Dieri',138,-28.1667,'both'
'5','Dieri',138,-28.1667,'both'
'6','Finnish',25.5577,64.7628,'non-spatial'
'7','Crimean Tatar',28.1418,43.8398,'spatial'
'8','Sochiapam Chinantec',-96.6079,17.7985,'non-spatial'
'9','Ese Ejja',-67.515,-11.7268,'non-spatial'
'10','Makhuwa',38.8052,-14.8509,'non-spatial'
'11','Mualang',111.077,0.31083,'non-spatial'
'12','Martuthunira',116.607,-20.9294,'non-spatial'
'13','Evenki',108.626,53.85,'both'
'14','Afrikaans',30,-22,'both'
'15','Male (Ethiopia)',36.9892,5.91975,'both'
'16','Manchu',126.557,47.3122,'both'
'17','Dime',36.3329,6.20951,'non-spatial'
'18','Koorete',37.8679,5.80545,'non-spatial'
'19','Wolaytta',37.7537,6.32668,'both'
'20','Dizin',35.5763,6.1405,'both'")

map <- openproj(openmap(c(85, -179.9), c(-60, 179.9), zoom = 2, type = "nps"))
plot <- autoplot(map) + 
  geom_point(data = data, aes(x = longitude, y = latitude),
             color = "white", alpha = 0.8, size = 8) +
  geom_point(data = data, aes(x = longitude, y = latitude, color = sp_sum),
             alpha = 0.3, size = 4)
plot
5
  • Is there anything I can improve to make the question easier to understand and answer? Please let me know if you have any ideas!
    – maj
    Commented May 30, 2015 at 12:13
  • 1
    This is not a question I have relevant skills to assist with but I have upvoted it to make it appear that little bit higher in some lists. If you do not get any comments that help improve it, and in any event, I recommend reviewing/revising it at frequent intervals taking heed of the advice offered at meta.gis.stackexchange.com/a/3353
    – PolyGeo
    Commented Jun 2, 2015 at 21:46
  • I'm thinking you might want to use some force-directed graph functionality. I'm not sure how to do it and keep some points anchored, but what I'm thinking is to identify all the clusters (by some proximity grouping function) and use the cluster centroid as an anchor and let its members float (and not plotting the centroid itself -- just using it to anchor the connected vertices in its little graph). And of course, if any clusters have only one member then those should be anchored to their location as well.
    – aaryno
    Commented Jun 5, 2015 at 18:15
  • I didn't follow the aside at "... again seems only to apply to scatterplots," because this is a scatterplot.
    – whuber
    Commented Jun 19, 2015 at 14:39
  • I admit I must have used a wrong term - what I meant to say by scatterplot was the typical statistical scatterplot where position is generally less important than in the kind of plot we have here (= a map - if points are moved here, it's obvious immediately).
    – maj
    Commented Jun 20, 2015 at 7:53

2 Answers 2

2

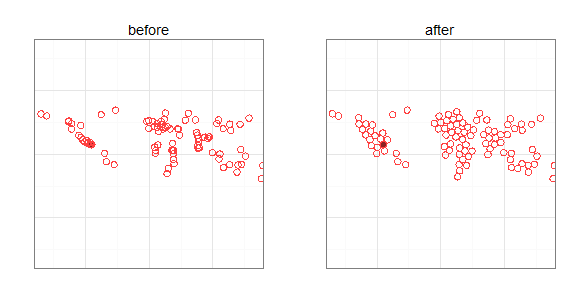
So far I have found only one fairly decent looking workaround: The packcircles R package may have been designed for another purpose, but it does a nice job pushing the points away from each other (also see corresponding blog post). I might not understand all of the inner workings of this package, but luckily, as you will find, the example file from the website can be used almost directly - all one needs to change are the variable names, the distance between circles (or points, depending on the functions you use) and the "limits" of the graph (i.e. 180°).

(In the end it all comes down to the circleLayout() function, which takes a data frame with lon, lat and radius (i.e. distance) columns and two 2-numeric xlim/ylim vectors - it returns the data frame with improved point positions.)

"Plot" that is usually created by packcircles - you can see it working here already. map

  • please compare this 'after' map with the 'before' map snippet from the question
0

Something like this, perhaps?

data$spacing_x = 5
data$spacing_y = 5

for(i in 2:nrow(data)) {
  if( abs(data$latitude[i]-data$latitude[i+1]) < 2 ) {
    data$spacing_y[i] = data$spacing_y + 6 +jitter(data$spacing_y,8)
    data$spacing_y[i+1] = data$spacing_y + 6 + jitter(data$spacing_y,8)
  }
}

for(i in 2:nrow(data)) {
     if( abs(data$longitude[i]-data$longitude[i+1]) < 2 ) {
      data$spacing_x[i] = data$spacing_x + jitter(data$spacing_x,4)
      data$spacing_x[i+1] = data$spacing_x +jitter(data$spacing_x,4)
     }
}

for(i in 2:nrow(data)) {
  if( abs(data$spacing_y[i]-data$spacing_y[i+1]) < 1.5 ) {
    data$spacing_y[i] = data$spacing_y + 2 
    data$spacing_y[i+1] = data$spacing_y + 2
  }
}

for(i in 2:nrow(data)) {
  if( abs(data$spacing_x[i]-data$spacing_x[i+1]) < 1.5 ) {
    data$spacing_x[i] = data$spacing_x + 2 
    data$spacing_x[i+1] = data$spacing_x + 2
  }
}


plot = autoplot(map) + 
  geom_segment(data = data
               , mapping=aes(x=longitude
                             , y=latitude
                             , xend=longitude + spacing_x
                             , yend=latitude + spacing_y)
               , size=0.5, color="black"
               , alpha = 0.9) +
  geom_point(data = data
             , aes(x = longitude+spacing_x
                  , y = latitude+spacing_y)
             , color = "white"
             , alpha = 0.8, size = 8) +
  geom_point(data = data
             , aes(x = longitude+spacing_x
                   , y = latitude+spacing_y
                   , color = sp_sum)
             , alpha = 0.3, size = 4)
  xlab("") +
  ylab("")
plot
4
  • I see. You tried to replicate the "lines to the original position" from the screenshot from wals.info, didn't you? It's a start, I guess. But if I see this correctly, it won't solve the better part of my problem (e.g. points still overlap).
    – maj
    Commented May 30, 2015 at 13:27
  • The rest should be data frame manipulation. An if/for loop can govern spacing -- a statement therein can also say that if the spacing between to points is less than x, mark them as such and that marker can be used to concatenate the points
    – lnNoam
    Commented May 30, 2015 at 13:36
  • hopefully someone, or you, can fix my ugly for loops. Good luck.
    – lnNoam
    Commented May 30, 2015 at 14:13
  • @InNoam: In fact, I am open towards hints as to how this 'data frame manipulation' could work.
    – maj
    Commented Jul 27, 2015 at 10:19

Your Answer

By clicking “Post Your Answer”, you agree to our terms of service and acknowledge you have read our privacy policy.

Not the answer you're looking for? Browse other questions tagged or ask your own question.