1

I apologize in advance for my lack of knowledge. I don't know a great deal about working with this program, so I'm learning as I go. I am wanting to take the free Landsat data that I have downloaded and turn it into a NDVI shapefile for use in another agriculture program.

I have downloaded the data and imported Bands 4 and 5 into QGIS. Since this is for a particular field, I used a shapefile of the field boundary to clip the image. I then used the Raster Calculator to generate a GeoTIFF using the expression (Band5-Band4)/(Band5+Band4). I also changed the layer properties so that I can visualize the data on a RedYellowGreen scale. This looks good so far.

I now need to turn this clipped GeoTIFF into a shapefile so that I can import it into my other program. I have tried the polygonize (Raster to Vector) but this doesn't seem to give me what I am needing. Could someone point me in the right direction, please?

6
  • You can use Raster/Conversion/Polygonize to create polygons from raster. But if you have a float NDVI raster it won't help as every NDVI value will be different. You should convert float raster to integer before polygonize (see: gis.stackexchange.com/questions/146543/…)
    – Zoltan
    Commented Jan 24, 2017 at 15:17
  • Thank you for the reply. I just attempted this, but I don't see that it did what I'm looking to do. Maybe if I explain what I'm hoping the end result to be, you can make sure I'm on the right track. Maybe the polygonize wasn't what I needed.
    – jdeere9750
    Commented Jan 24, 2017 at 23:24
  • I would like to end up with a map that shows multiple NDVI readings for a specific field at the highest resolution possible so I can see the NDVI variation within this field. I'm wanting to get a shape file that contains lat/lon data and the NDVI reading at that point. Example: for every pixel on the map, could it find the center, and give me lat/lon/ndvi output as a shape file? Doesn't matter if it is point data or contoured shapes.
    – jdeere9750
    Commented Jan 24, 2017 at 23:33
  • 1
    To extract each cell value into point shapefile, you may find SAGA Raster values to points function useful. It is in QGIS Processing Toolbox | SAGA(2.12) | Vector to raster | Raster values to points
    – Kazuhito
    Commented Jan 24, 2017 at 23:54
  • @Zoltans comment: As far as I understand your purpose is to get an idea about the variation of your NDVI within a certain area "at the highest resolution possible". So if you start converting your NDVI-raster values from float into integer you should be aware that you are loosing information!
    – ADorsch
    Commented Jan 25, 2017 at 7:06

3 Answers 3

2

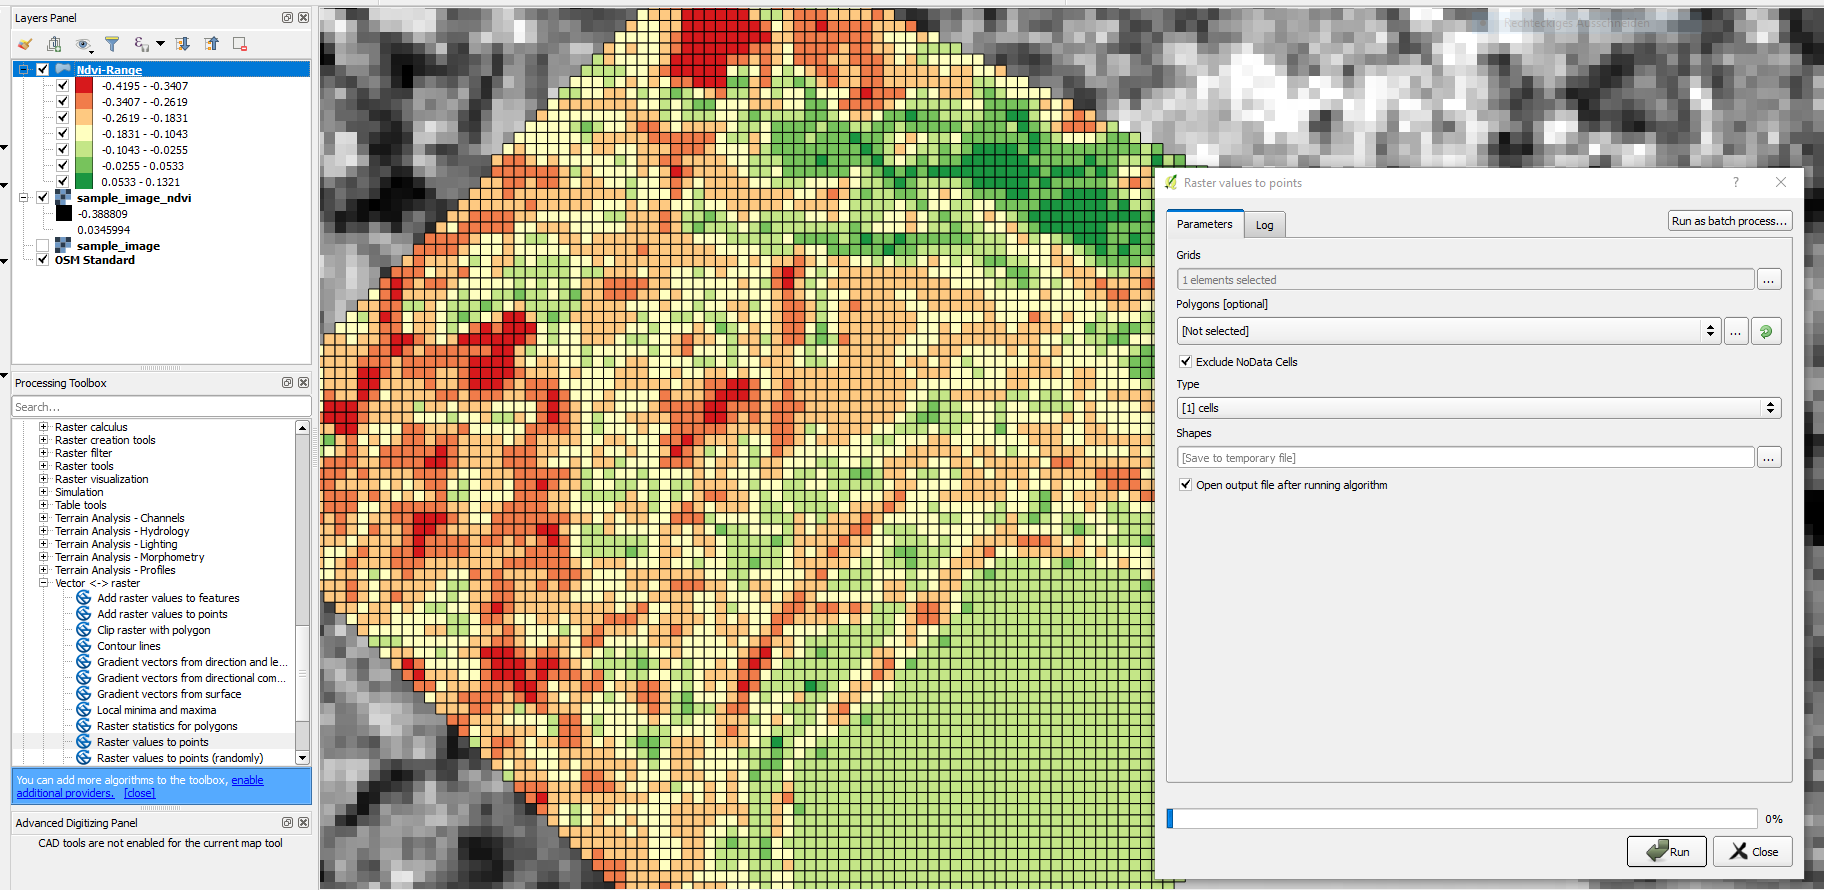
As Kazuhito suggested in the comments I guess you get what you want by using the "Raster values to points"-tool (from Processing toolbox -> SAGA). You keep your original NDVI cell values and get the according x/y-coordinates for each raster cell. By selecting "type: [ 0 ] node" you get points (center points), and by "type: [ 1 ] cells" you get polygon features for each raster cell.

You can change the style in the output shapefile symbology to a graduated style by using the classify function to vizualize the NDVI variation.

By the way, I used QGIS 2.18.2

enter image description here

9
  • +1 Nice way of using "[1] cells" option, to visualize the NDVI cells and values at the same time!
    – Kazuhito
    Commented Jan 25, 2017 at 8:27
  • Thanks! This is very close to what I need. Is it possible to get actual latitude and longitude instead of the x,y coordinates?
    – jdeere9750
    Commented Jan 25, 2017 at 15:05
  • This tool takes up the Project CRS. Please switch to geographical coordinates (such as WGS84, EPSG:4326) before running this tool. As long as your Project CRS stays in latlong, the (Derived) parameters will show X-Longitude and Y-Latitude. Meanwhile (Actions) parameters will always show XY of the original layer's CRS.
    – Kazuhito
    Commented Jan 26, 2017 at 1:42
  • I think it depends on the CRS of your target raster layer! If this is in lat-lon (e.g. WGS84), this tool should automatically take the according coordinates as X-lon, Y-lat, regardless of your project CRS. You can reproject your raster layer using "Raster -> Projections -> Warp(reproject) function!"
    – ADorsch
    Commented Jan 26, 2017 at 7:09
  • @ADorsch If you are talking about the (Actions) parameters, yes, it keeps raster CRS and it can be latlong. By the way, from my limited experience reprojection did not renew the attribute data created/stored by this tool.
    – Kazuhito
    Commented Jan 26, 2017 at 10:43
1

Your NDVI data is a continuos data field, varying in value from pixel to pixel, vector polygons are homogeneous surfaces. You will need to reclass the NDVI continuous data into discrete classes (woodland, urban etc) and then convert this raster into polygons

1

Thanks to all who contributed here, I was able to successfully convert the LandSat image I downloaded using the following steps.

Download the LandSat image from the web and unzip the data.

In QGIS:
- Add band 4 and band 5 images.
- Open the Raster Calculator (Raster Menu>Raster Calculator)
- Input the formula (Band5-Band4)/(Band5+Band4) double clicking the image layers in place of "Band5" or "Band4"
- Click OK to create an NDVI layer
- To visualize variation, open NDVI layer properties, change style to singleband pseudocolor, pick a color scheme, click classify to assign NDVI numbers to colors.
- I then added my field boundaries as layer
- I used the Clipper tool to clip the NDVI image with the shapefile boudaries (Raster Menu>Extraction>Clippper)
- Use Raster Values to Points tool (Processing Toolbox>SAGA) to create point shapefile layers

To convert the X,Y Coordinates to Lat/Lon:
In additions to the suggestions in this post, I also found this thread helpful.
How to convert x y coordinates to longitude latitude using QuantumGIS?

Your Answer

By clicking “Post Your Answer”, you agree to our terms of service and acknowledge you have read our privacy policy.

Not the answer you're looking for? Browse other questions tagged or ask your own question.