Here's a way in R:
Make a test raster, 20x30 cells, make 1/10 of the cells set to 1, plot:
> require(raster)
> m = raster(nrow=20, ncol=30)
> m[] = as.numeric(runif(20*30)>.9)
> plot(m)
For an existing raster in a file, for example a geoTIFF, you can just do:
> m = raster("mydata.tif")
Now get a matrix of the xy coordinates of the 1 cells, plot those points, and we see we have cell centres:
> ones = xyFromCell(m,1:prod(dim(m)))[getValues(m)==1,]
> head(ones)
       x    y
[1,] -42 85.5
[2,] 102 85.5
[3,] 162 85.5
[4,]  42 76.5
[5,] -54 67.5
[6,]  30 67.5
> points(ones[,1],ones[,2])
Step 1. Generate 1000 (xo,yo) pairs that are centred on 0 in a box the size of a single cell. Note use of res to get the cell size:
> pts = data.frame(xo=runif(1000,-.5,.5)*res(m)[1], yo=runif(1000,-.5,.5)*res(m)[2])
Step 2. Work out which cell each of the above points is going into by randomly sampling 1000 values from 1 to the number of 1 cells:
> pts$cell = sample(nrow(ones), 1000, replace=TRUE)
Finally compute the coordinate by adding the cell centre to the offset. Plot to check:
> pts$x = ones[pts$cell,1]+pts$xo
> pts$y = ones[pts$cell,2]+pts$yo
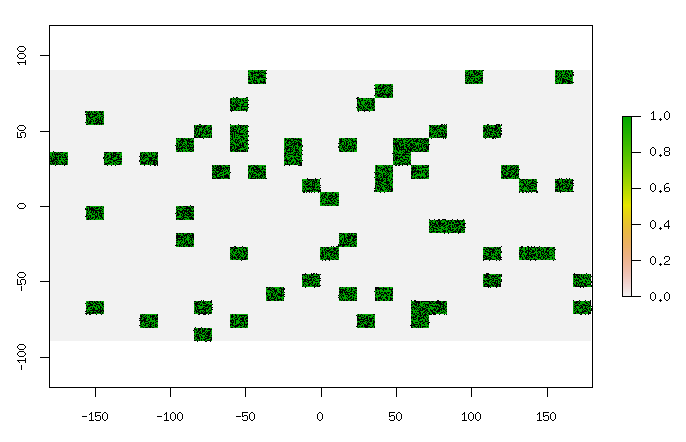
> plot(m)
> points(pts$x, pts$y)
Here's 10,000 points (replace the 1000 above with 10000), plotted with pch=".":

Pretty much instantaneous for 10,000 points on a 200x300 raster with half the points as ones. Will increase in time linearly with how many ones in the raster, I think.
To save as a shapefile, convert to a SpatialPoints object, give it the right coordinate system reference (the same as your raster) and save:
> coordinates(pts)=~x+y
> proj4string(pts)=CRS("+init=epsg:4326") # WGS84 lat-long here
> shapefile(pts,"/tmp/pts.shp")
That will create a shapefile that includes the cell number and offsets as attributes.


