7

Not being able to use true transparencies with ArcGIS colour ramps where only solid colours are allowed has me always wondering about how to improve the look of the surface in my maps without resorting to time-consuming post processing techniques. (For example the basic graduated black colour ramp typically used with hillshade does not have levels of transparent black but rather shades of grey and solid white where 100% should be. A as a result, it is not possible to overlay a hillshade without impacting the colours of the features under the hillshade; overlaid colours will appear washed out)

In this discussion @matt wilkie provides a link to GDAL's gdaldem for producing a hillshade without Spatial Analyst using. He also includes a link to Terrain Data Tutorial which shows how to how to use gdaldem to build a "composite hillshade with hypsometric tinting".

Can ArcGIS (Spatial Analyst, 3D Analyst) be used to produce a similar "blended" product?

2
  • Jakub can you fix the 'this discussion' link - thanks.
    – Mapperz
    Commented Jan 27, 2012 at 16:16
  • 1
    Jakub, could you please explain what "true transparencies" are and what are the "time-consuming post processing techniques" (to achieve them). Maybe then its easier to think of a solution. In the example of @matt wilkie you provide, in my opionion, the end result looks as "washed out" as in ESRI type blended hypsometric hillshades.
    – G-wizard
    Commented Jan 28, 2012 at 18:06

2 Answers 2

5

It's possible.

From the ArcGIS Resource Centre blog by rajnagi: An alternative to overlaying tints on hillshades.

This involves several steps, first of being to convert the DEM to an RGB based raster. This is done by "exporting" the raster to a new dataset after you've applied the desired colour ramp.

I'm posting the article contents below as sometimes links can disappear and become null.

From the article:

At the core of this display method is a combination of pan-sharpening, contrast stretching, and gamma stretching functions. The pan-sharpening function uses a panchromatic and a multispectral (three-band RGB) raster as input. In the example here, the inputs are (1) a hillshade created from a DEM as the panchromatic raster and (2) a DEM with a color ramp that has been converted to a multispectral raster. The output from the pan-sharpening function is then used as input for the contrast and gamma stretching functions.

Since layer-tinted DEMs are not usually managed as three-band RGB rasters, a conversion is required.

To do this, add the DEM to ArcMap, right-click the layer in the table of contents, and click Properties. On the Symbology tab, select the color ramp you want to use to display the data.

Click OK to close the Layer Properties dialog box. Right-click the layer in the table of contents, click Data, and click Export Data.

In the Export Raster Data dialog box, check Use Renderer and check Force RGB.

Choose a location and input a name, then click Save. Choose to add the exported data to the map as a layer. The three-band RGB image will be added to the table of contents.

At this point, you can either follow the steps described in the previous article to add the raster to a mosaic dataset and render it, or you can use the instructions below if you want to use the Image Analysis tools instead of a mosaic dataset.

Define the functions for the raster datasets by following the steps below:

Add the grayscale hillshade and multispectral RGB layer tint rasters to ArcMap, if they have not already been added.

Open the Image Analysis window by clicking Windows on the top bar menu, then clicking Image Analysis.

In the top section of the Image Analysis window, select both the hillshade and RGB rasters using the Control key and clicking on each raster’s name to highlight it. Click the Pan-Sharpening tool in the Processing section of the Image Analysis window. This will create a new layer, which will be listed as the top layer in the Image Analysis window.

In the Image Analysis window, right-click the newly generated pan-sharpening layer and click Properties.

On the Functions tab, right-click the Pansharpening Function and click Properties. On the General tab of the Raster Function Properties dialog box, change the Output Pixel Type to 8 Bit Unsigned.

On the Pan Sharpen tab, change the Method to Simple Mean. Keep the rest of the defaults and click OK.

Right-click Pansharpening Function, click Insert, and click Stretch Function. Change the Type to Minimum-Maximum.

Check the Use Gamma option.

In the Gamma section of the dialog box, change the Gamma value from 1.0 to 0.5 for each of the three bands.

In the Statistics section of the dialog box, type 5 as the Min and 215 as the Max value for each of the three bands.

Click OK to check your results. After checking the results, feel free to experiment with the gamma, minimum, and maximum values in the Stretch Function.

Creating your display by using the Image Analysis window instead of mosaic datasets results in a temporary raster. If you want to keep your results, export the layer that you added the functions to from ArcMap. To do this, right-click the layer in the table of contents and click Export Data. The data you save can now be added to an ArcMap session and will display with the final results.

3
  • Looks like exactly what I was looking for. I will try this as soon as I have some time. Commented Mar 29, 2012 at 17:24
  • I was disappointed at first but after tweaking the Stretch Function parameters i was able to make it look almost the way i wanted. There seems to be a bit of a yellow overcast similar to using a warming photographic filter in Photoshop but not bad, not bad at all. Many thanks! Commented Apr 30, 2012 at 15:51
  • I was just going to add that exaggerating the input hillshade helps a lot here, especially if the RGB image is dark. Commented May 1, 2012 at 15:52
4

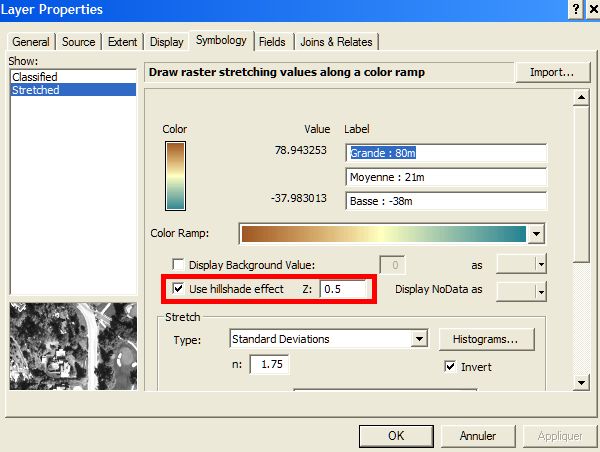
I'm not sure if this is what you are looking for, but you can achieve this using the "Use hillshade effect" option in the layer properties of your floating point raster:

enter image description here

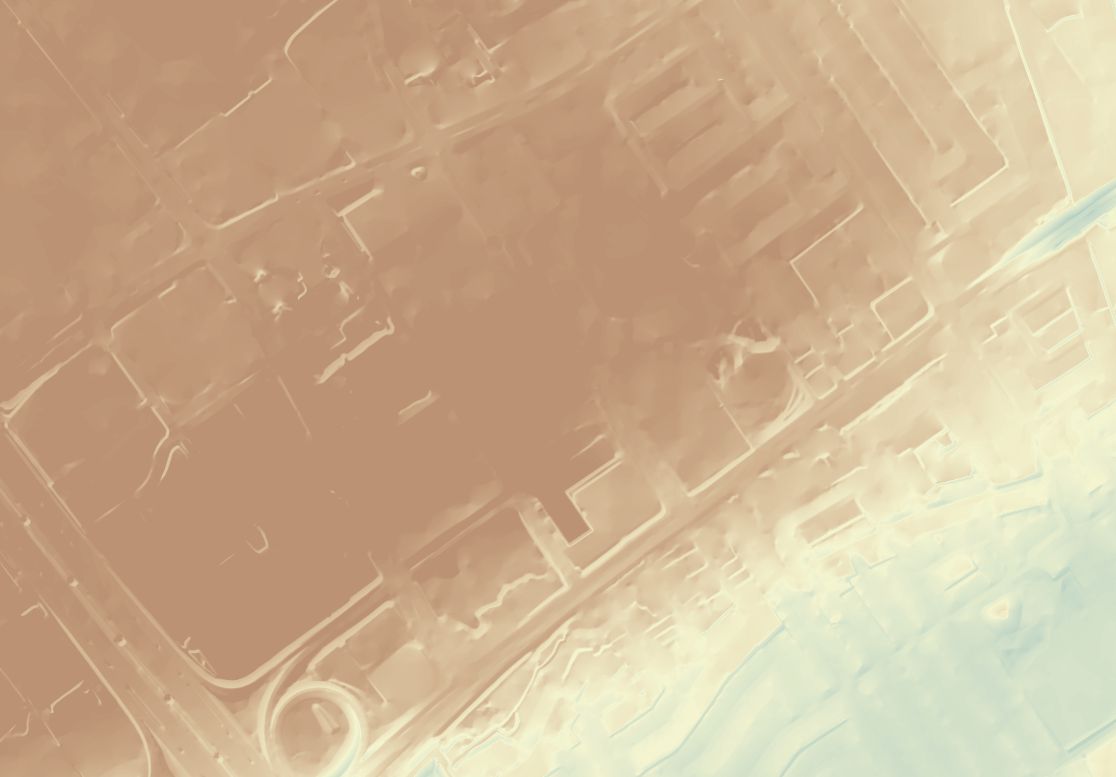
Here is a snapshot of the layer alone:

enter image description here

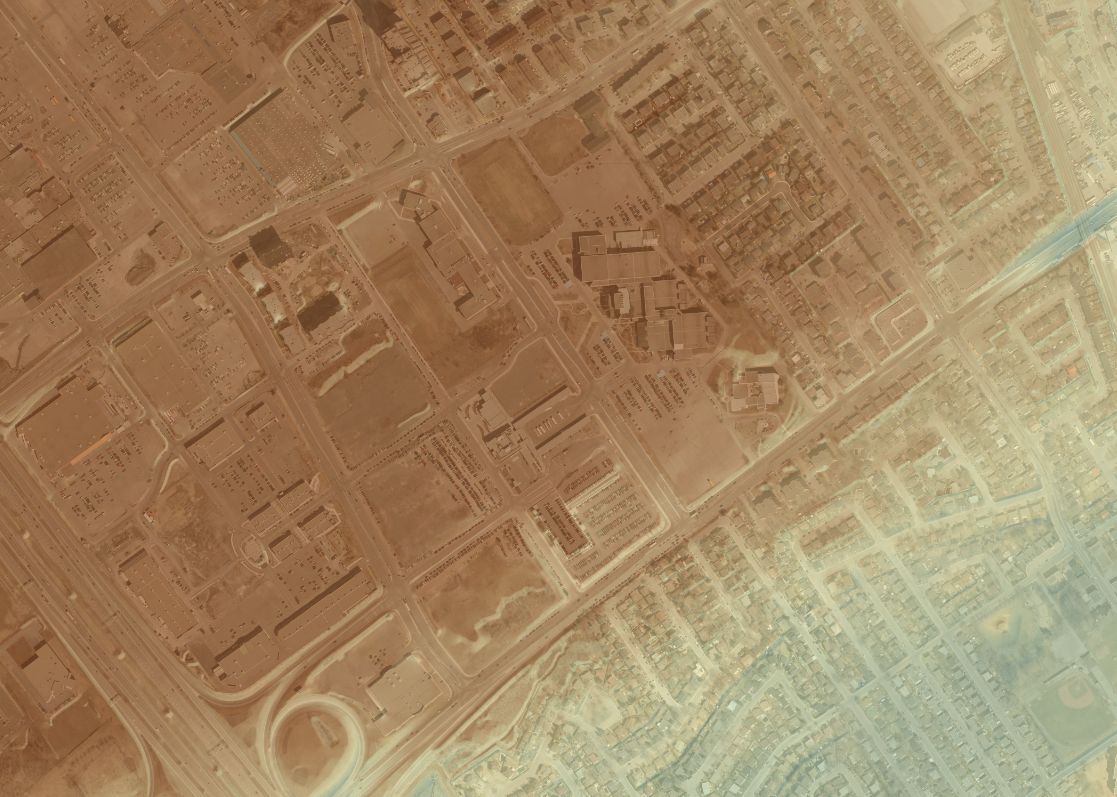
And another with imagery underneath

enter image description here

3
  • Thanks. This is not what i am looking for. I would like to physically combine the Shaded Relief, the DEM with a defined colour ramp into one raster Commented Jan 27, 2012 at 17:07
  • Jakub, I thought Brent did a great job of addressing what your question seems to ask. Since this isn't what you're looking for, do you think you could edit the question to help us understand what a good reply would look like? An illustration of what you're trying to achieve would be really nice.
    – whuber
    Commented Jan 27, 2012 at 17:38
  • I think Jakub wants to calculate his hillshade separately (controlling sun angle etc) and then layer it up with the DEM, but avoid the colour wash-out he mentions. So, while Brent's answer is a great approach, it won't always give the desired result. The only way I can think of is to turn your hillshade into a multi-band raster where one band is an alpha channel. CAVEAT: I've not tried this (I'm away from a computer with Arc on it), but could you have two bands. 1 is your hillshade and the second one is based on you hillshade but declared to be an Alpha channel. Commented Jan 28, 2012 at 16:53

Your Answer

By clicking “Post Your Answer”, you agree to our terms of service and acknowledge you have read our privacy policy.

Not the answer you're looking for? Browse other questions tagged or ask your own question.