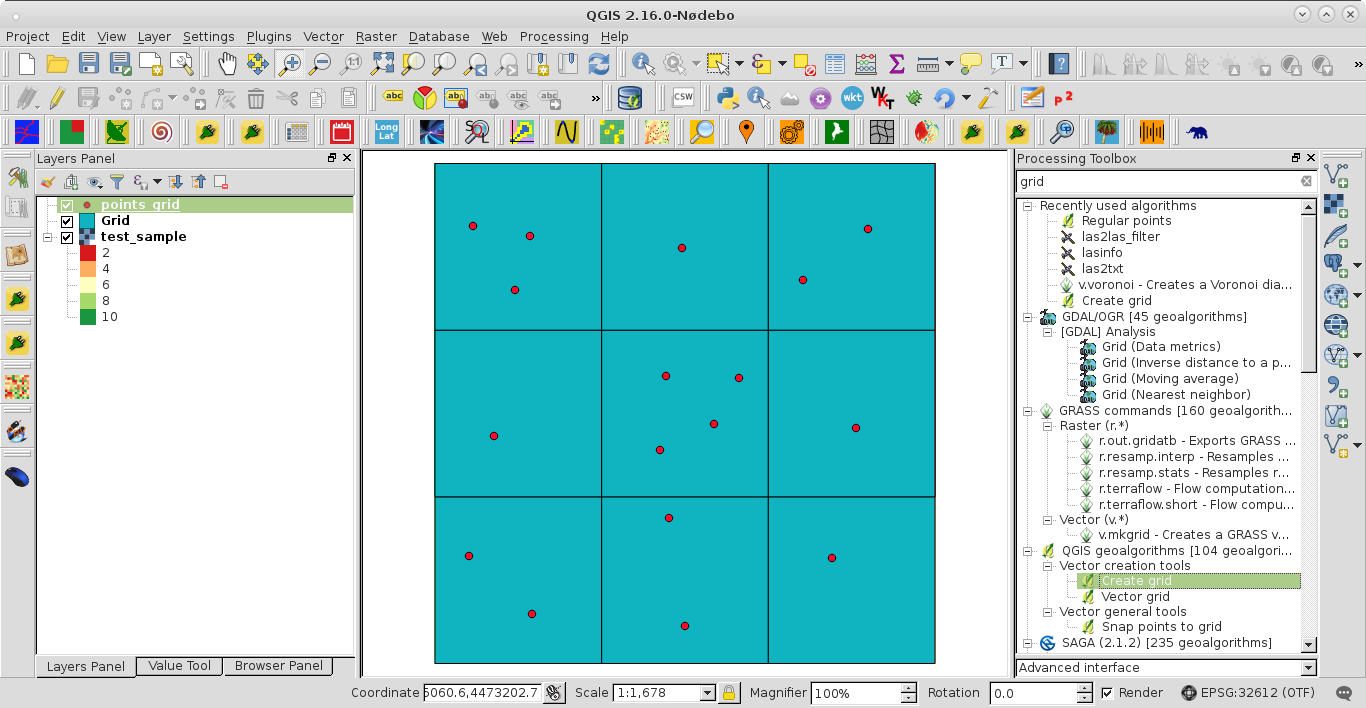
You can use GDAL Python to rasterize, however, before it is necessary a little bit of Python (in my case PyQGIS). I tried out my approach creating a little raster of 3x3 (to facilitate results validation) and, afterward, I used 'Create grid' processing tool for getting a Grid shapefile perfectly aligned with raster layer. Another shapefile, with a variable quantity of points per raster cells, was also created. This point shapefile has a field (named 'field'; see 'attribute' method in below code) with random float values. All set can be observed at the next image:

Next code select values in 'field' field of point shapefile and, if they are within of each feature of Grid shapefile, they are grouped by row and column indexes (for working in the case of random points with no consecutive id by cell). These values are also printed at the Python Console of QGIS.
mapcanvas = iface.mapCanvas()

layers = mapcanvas.layers()

points = [ feat for feat in layers[0].getFeatures() ]

grid = [ feat for feat in layers[1].getFeatures() ]

rextent = layers[2].extent()
rprovider = layers[2].dataProvider()

xmin = rextent.xMinimum()
ymax = rextent.yMaximum()
xsize = layers[2].rasterUnitsPerPixelX()
ysize = layers[2].rasterUnitsPerPixelY()

elements = []

for i, point in enumerate(points):
    posX = point.geometry().asPoint()[0]
    posY = point.geometry().asPoint()[1]

    row = int((ymax - posY)/ysize)
    col = int((posX - xmin)/xsize)

    for j, item in enumerate(grid):
        if point.geometry().within(item.geometry()):
            elements.append([row, col, point.attribute('field')])

elements.sort( key=lambda x: (x[0], x[1]) )

n = len(elements)

values = [ [] for i in range(len(grid)) ]

k = 0

values[0].append(elements[0][2])

for i in range(n-1):
    if elements[i][0] == elements[i+1][0] and elements[i][1] == elements[i+1][1]:
        values[k].append(elements[i + 1][2])
    else:
        k += 1
        values[k].append(elements[i+1][2])

print values
After running the code at the Python Console of QGIS the printed values were:
[[58.1, 62.66, 12.93], [40.23], [93.21, 41.74], [3.23], [63.45, 56.86, 63.22, 57.62], [22.0], [48.23, 95.04], [50.23, 35.13], [43.48]]
There are nine lists because raster is 3 x 3. Each internal list has point values per each cell and its quantity is equal to number points. Now, it's easy to extract minimum, maximum or mean per cell and rasterize these values by using GDAL python module (after reshape and convert them in array with numpy).

