3

I've calculated relative heights in ArcGIS, now I'd like to calculate relative heights (range between maximum and minimum cell value in window 3x3) in SAGA. It's important that I don't want standardized values (0-1).

There is a module called "Relative Heights and Slope Positions", it creates few outputs, but they don't correspond directly to results calculated in ArcGIS (Focal Statistics)

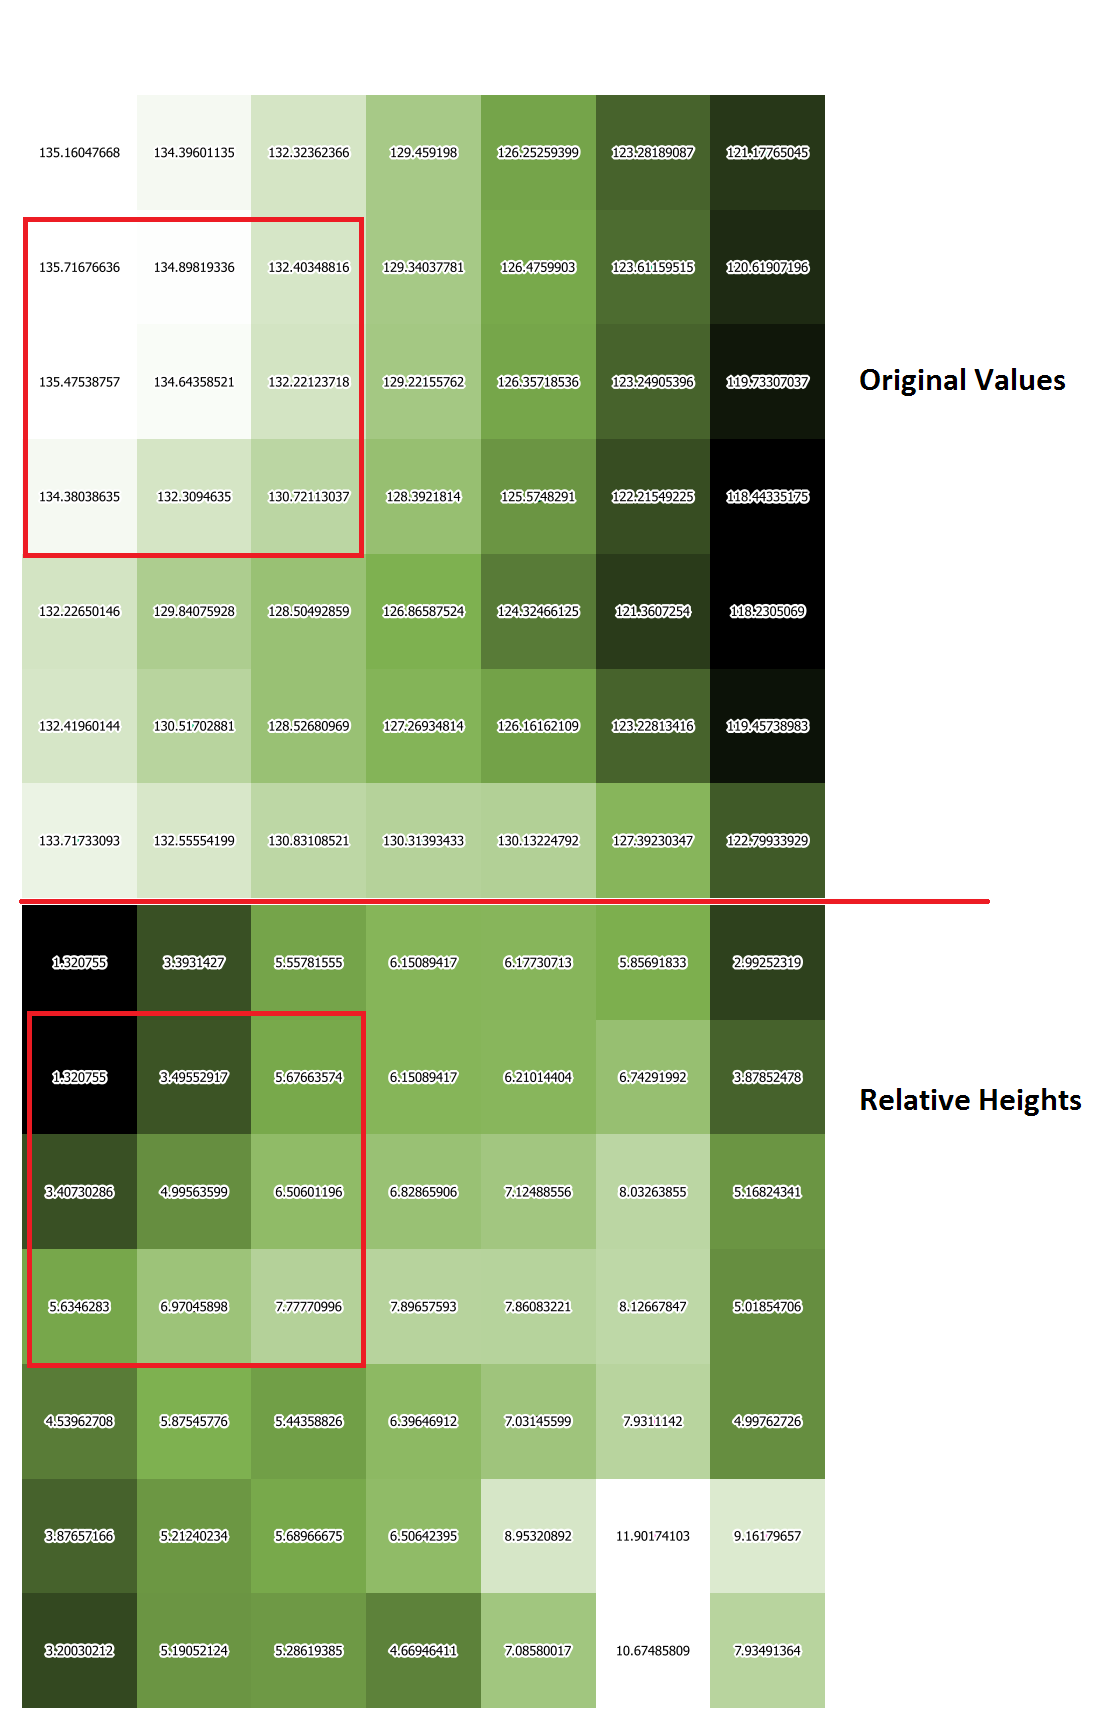
These are sample results from ArcGIS:

enter image description here

Does anyone know how to convert the results from SAGA into values like I've calculated in ArcGIS with mentioned module or other SAGA module?

3
  • The 'standardised heights' output should actually be the one you're looking for - its normalised heights (0-1 scale) multiplied by the original DEM. I'm just not sure how to adjust the three weighting factors the tool requires appropriately - the documentation isn't very clear on what exactly they do. How far 'off' is the SH output from your arcgis one?
    – obrl_soil
    Commented Nov 7, 2016 at 21:51
  • SH in the center of red frame is 129,5753479. According to you I could calculate normalised height, but how compute real range between max and min values in window 3x3? I should denormalised that in some way?
    – ami
    Commented Nov 7, 2016 at 22:55
  • Ah my bad, SH is a whole-of-DEM thing. See my answer below.
    – obrl_soil
    Commented Nov 7, 2016 at 23:24

1 Answer 1

1

I think you're actually looking for the Topographic Ruggedness Index, which is another tool in the SAGA Terrain Morphometry toolbox. You'd run it with a 3 cell window to mimic the Arc output.

More here - How to calculate Topographic Ruggedness Index in ArcGIS Desktop?

edit: nope, wrong again. I've been poking through the Grid toolboxes but can't find anything useful, hopefully someone else more familiar with the tools can help. What you want is easy in R, though:

library(raster)

r <- raster('path\\to\\your\\file.ext')

winmin <- function(x) min(x, na.rm = T)
winmax <- function(x) max(x, na.rm = T)

focalmin <- focal(r, w = matrix(1, ncol = 3, nrow = 3), winmin)
focalmax <- focal(r, w = matrix(1, ncol = 3, nrow = 3), winmax)
rel_el <- abs(focalmin - focalmax)
writeRaster(rel_el, file='path\\and\\output\\filename.ext')

you'll just lose a ring of cells around the edge of the raster.

2
  • It's not exactly what I'm looking for. In your link we can read "The process essentially calculates the difference in elevation values from a center cell and the eight cells immediately surrounding it. Then it squares each of the eight elevation difference values to make them all positive and averages the squares. The topographic ruggedness index is then derived by taking the square root of this average, and corresponds to average elevation change between any point on a grid and it’s surrounding area" I need tool which could a) find max value in windos 3x3, b) find min, c) return max - min
    – ami
    Commented Nov 8, 2016 at 0:03
  • yep i see now, see above
    – obrl_soil
    Commented Nov 8, 2016 at 0:35

Your Answer

By clicking “Post Your Answer”, you agree to our terms of service and acknowledge you have read our privacy policy.

Not the answer you're looking for? Browse other questions tagged or ask your own question.