2

I am finding some methods that can provide simple output.

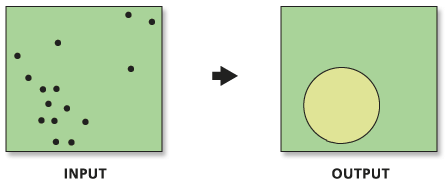
I found a useful method StandardDistance_stats in ARCGIS, but the result is not what i am looking for, I only need the result of a lat/lng point and the size of the circle in number form, so I can plot it to my web map.

enter image description here

Now I am using geomean in geosphere package, it gives the mean of lat/lng points but still missing the size of the circle.

Edit: I found a solution for it, but I am stuck in import R script into Java

d <- read.csv(file="./points.csv", header=TRUE, sep=",")
x <- d$lng
y <- d$lat
w <- d$weight
df <- data.frame(x,y)
mean = geomean(df,w)
.sdd <- function(t,mean) {
    x <- t$lng
    y <- t$lat
    x <- x-mean[1]
    y <- y-mean[2]
    x <- x*x
    y <- y*y
    result <- (Reduce("+",x)/length(x))+ (Reduce("+",y)/length(y))
    result <- sqrt(result)
    return(result)
}
.sdd(d,mean)

Edit: I was trying to run R script file in java. i figured it out. It was because the permission problem, I was not allowed to access the root of C drive.

Base on this answer, I am not sure what should I modify in this line. I know that there are lots of Datums. if my list of lat/lng are mostly 22.0,144.0m is this line still suitable?

CRS.new <- CRS("+proj=somerc +lat_0=46.9524056 +lon_0=7.43958333 +ellps=bessel +x_0=2600000 +y_0=1200000 +towgs84=674.374,15.056,405.346 +units=m +k_0=1 +no_defs")
6
  • The formula for "standard distance" is given in the link on the ArcGIS documentation page you linked to, so if you can't find it in a package then it would be really easy to write a function to do it yourself. You probably want to use projected coordinates, not lat-long though, as it probably only makes sense on a small part of a sphere.
    – Spacedman
    Commented Nov 14, 2016 at 8:02
  • "Calculations based on either Euclidean or Manhattan distance require projected data to accurately measure distances." therefore it does not work with longitude latitude
    – gene
    Commented Nov 14, 2016 at 12:49
  • See the R manual pages for mean, sd, and var. The latter is the most useful because it can be used to estimate a standard ellipse rather than just a circle.
    – whuber
    Commented Nov 14, 2016 at 15:28
  • "import R script into Java"? Java? Where did that come from? Did you really mean Javascript (because you mentioned web maps)? Do you really want this calculation done in Javascript?
    – Spacedman
    Commented Nov 14, 2016 at 15:43
  • @Spacedman I want to build a api, so I can call it when I need to use in the web map
    – peter
    Commented Nov 15, 2016 at 7:14

1 Answer 1

2

"Calculations based on either Euclidean or Manhattan distance require projected data to accurately measure distances." therefore it does not work with longitude latitude (or using a package like circular (Circular Statistics) for the mean and standard distance, and an appropriated distance )

With projected data (euclidean)

x = c(203595.92857397342, 203711.9297397244, 203992.57772137996, 203756.83341678928, 203610.89646632838, 203393.86202718143, 203524.83108528735, 203696.96184736944, 203363.9262424715, 203887.8024748952, 204018.77153300116, 204131.03072566338, 204426.6465996739)
y = c(89463.34428931243, 89343.60115047272, 89246.30985016546, 89152.76052294695, 89253.79379634294, 89343.60115047272, 89122.82473823702, 88991.85568013109, 89609.28123977332, 89687.86267463688, 89556.89361653096, 89901.15514069512, 89833.79962509777)
mean_centerX <- mean(x)
mean_centery <- mean(y)
standard_deviationX = sd(x)
standard_deviationY = sd(y)
standard_distance <- sqrt(sum(((x -mean_centerX)^2(y-mean_centerY)^2))/(length(x)))
library(plotrix)
plot(x,y)
points(mean_centerX,mean_centery,col="red",pch=16)
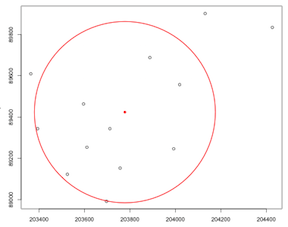
draw.circle(mean_centerX,mean_centery,radius=standard_distance,border="red",lwd=2)

enter image description here

Your Answer

By clicking “Post Your Answer”, you agree to our terms of service and acknowledge you have read our privacy policy.

Not the answer you're looking for? Browse other questions tagged or ask your own question.