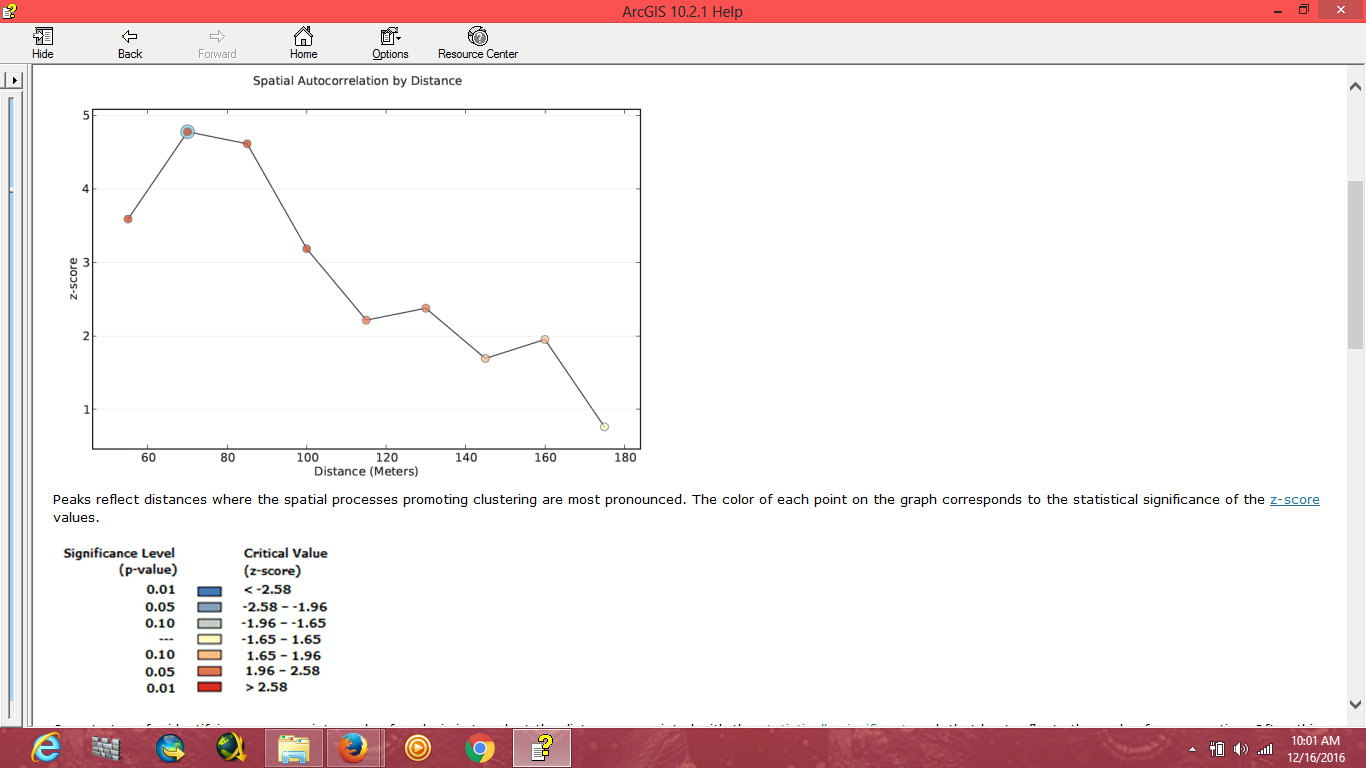
In determining correlation between layers, one method to use is the "point data" and "rank field" you have in your attribute data. For suitable assessment, i suggest your points should not be less than 30. You can use "Incremental Spatial auto correlation" in Arc Map. This tool will need your "point data", and "ranked field" to produce probability value( p or z value) against distances. There are set of value for "p" or "z" to accept correlation or to consider it null.
see the image below of an incremental spatial auto correlation.

The distances in graph that has trends has their points in the graph circled blue. Trace the distances from the blue circled points, to generate a hot or cold spot analysis map. The hot or cold spot map including graph from incremental spatial auto correlation will help interpret the map where there are increased and low fire risk.
Hotspot analysis map image.(The traced distance from the graph will be used for Hotspot Analysis map)

You can get this tools from,
Incremental spatial Auto correlation > Arc Toolbox > Spatial Statistics > Analyzing Patterns >Incremental Spatial Auto correlation
(Please take output Report, that is the graph).
Hotspot Analysis Map>Arc Toolbox > Spatial Statistics > Analyzing Patterns > Hotspot Analysis
(self potential field = distance from Incremental spatial autocorrelation)


