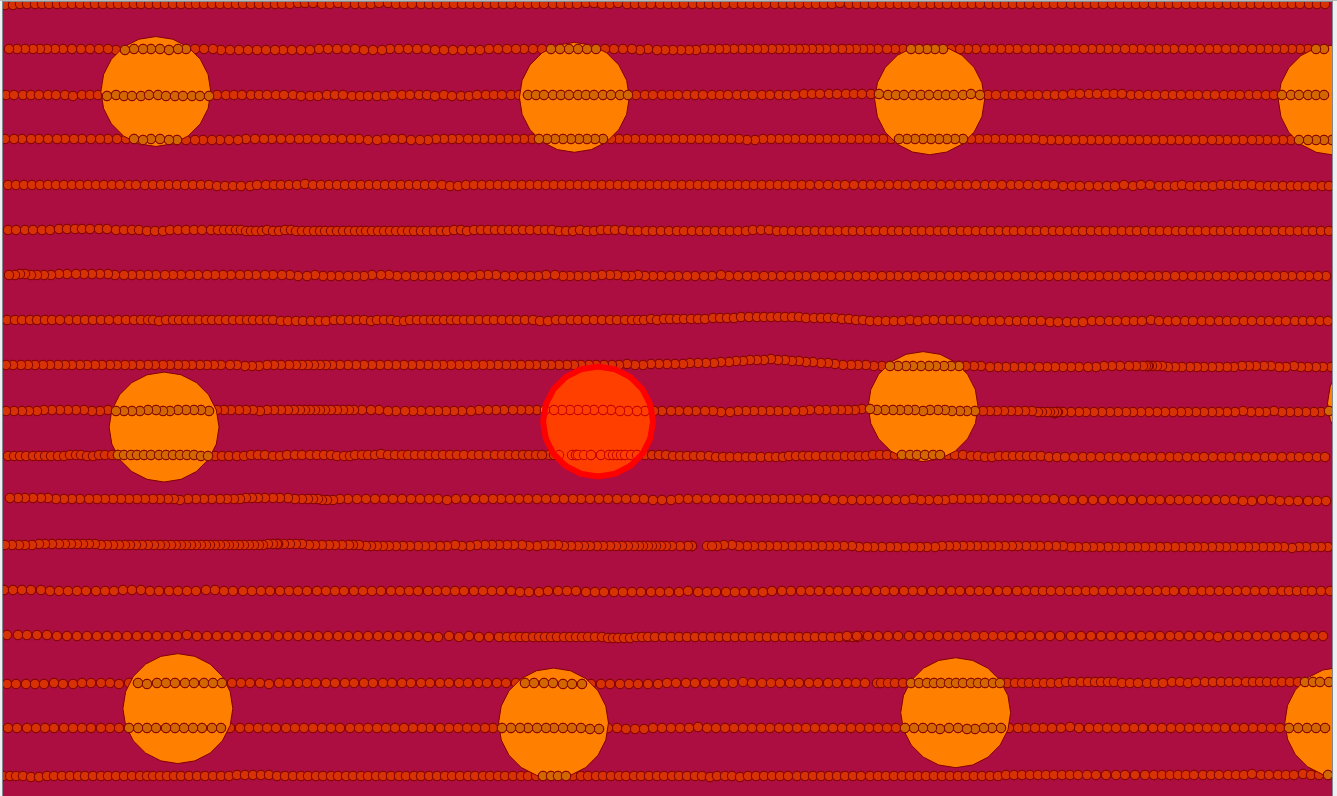
What I am trying to do is average a set of points with a separate boundary.
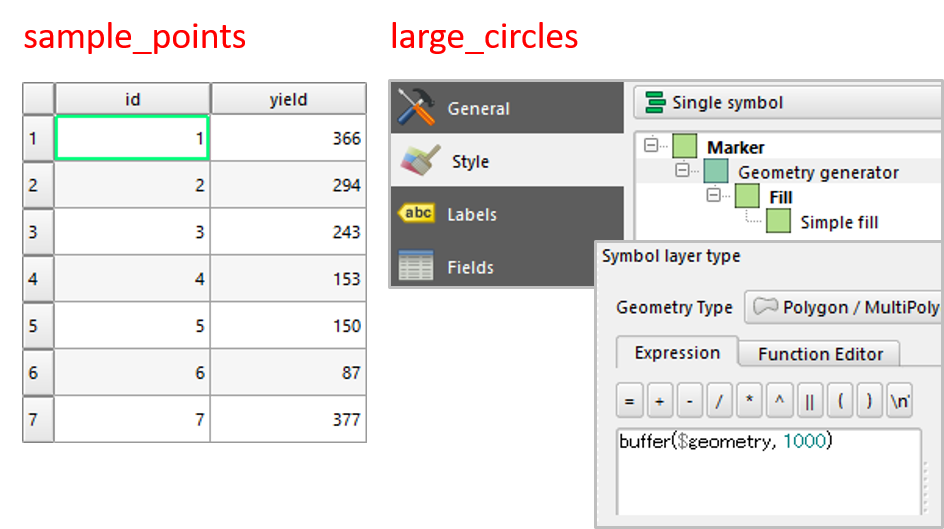
Each of the larger circles is a fixed distance around a sample point (typically the area sampled) with each of the smaller points being a yield point. What I have been doing in the past is creating an averaged raster grid of yield and then using the point sampling tool to give me a yield per sample point (with attributes of the sample included).
While this is a fairly good process, it has hard edges and the points do not always end up in the center of the grid.
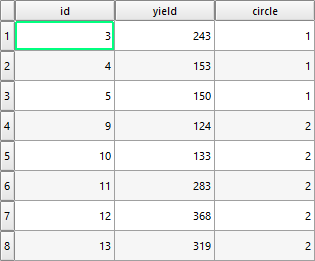
What I would like to do is use a similar process as the point sampling tool, but with a noticeable difference. I would like to return the aspects of the sampling attributes along with the average and standard deviation of the yield points within the boundary. I am only needing them in a csv/txt file to run them through some statistics to find relationships.
Is there a process out there someone has used to solve a similar problem?


