3

I have a large 2m DEM which consists mostly of mountains. But here and there there are depressions in the terrain which I need to find, or even better, automatically find in contour lines I'm planning to do.

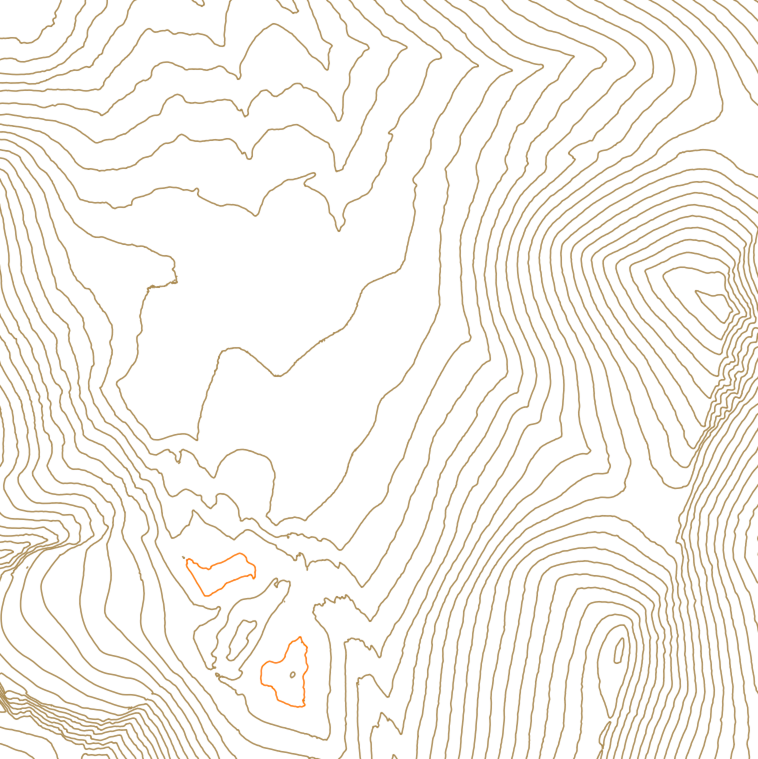
contour lines with two depression contours

Here's a sample image of contours from a small a part of the region, I have (manually) marked the depression contours as yellow.

In my final map I'm going to give the depression another style than the other contour lines so that the person using this map doesn't think it might be a hill!

Now I hope this is possible to achieve automatically in one way or another. The contour lines are generated using gdal_contour and has an ELEV attribute field.

5
  • I've asked something similar. Maybe this could be interesting for you: gis.stackexchange.com/questions/223532/….
    – Stefan
    Commented Feb 27, 2017 at 13:00
  • @OskarKarlin I think you should edit your question because it isn't very clear which is your goal. The best would be attaching an image or adding some text where you explain better what are you looking for. I have the contours that you attached in the question linked above, but I don't know what I can do on it.
    – mgri
    Commented Feb 28, 2017 at 8:13
  • @mgri, rewrote the question. Hopefully it's more understandable than before. Also even though the data set is much larger than the image above, some of the contour lines will disappear without having closed lines. I guess all those lines would not be depressions. So one way might be to only extract closed lines from the shape file and then run your script mentioned in the other question by @Stefan?
    – oskarlin
    Commented Feb 28, 2017 at 8:46
  • @OskarKarlin thanks, now it's clearer! I'll try to think about it and I'll give you a feedback as soon as I can.
    – mgri
    Commented Feb 28, 2017 at 9:09
  • In my question I adressed that I processed a "Depth In Sink" raster with WhiteBox (GIS). My idea is also to clean this raster from small raster cells (gdal_sieve) and to intersect with (or find nearest) contour data.
    – Stefan
    Commented Feb 28, 2017 at 14:27

1 Answer 1

2

It sounds like you have the original surface model so to identify the depressions use a sink algorithm. Here is a link to filling sinks using QGIS.

I have not used this tool in QGIS, only something similar in ArcGIS so I am not sure of the output. In any case, you could subtract the sink output surface from the original surface. Any greater than zero pixel would be a depression.

1
  • Nice! I ran this function and then used gdal_calc.py to subtract the original dem from this Sink DEM. Ended up with a raster showing all holes. After that I could polygonize and then clip the contour lines with that polygon turning all depressions into one shape file and the rest into another.
    – oskarlin
    Commented Mar 30, 2017 at 12:38

Your Answer

By clicking “Post Your Answer”, you agree to our terms of service and acknowledge you have read our privacy policy.

Not the answer you're looking for? Browse other questions tagged or ask your own question.