Load libraries and example data
# Load libraries
library('raster')
library('geosphere')
library('mapview') # incredible interactive map visualization in R

# Get SpatialPolygonsDataFrame object example
polygons <- getData('GADM', country = 'URY', level = 1)
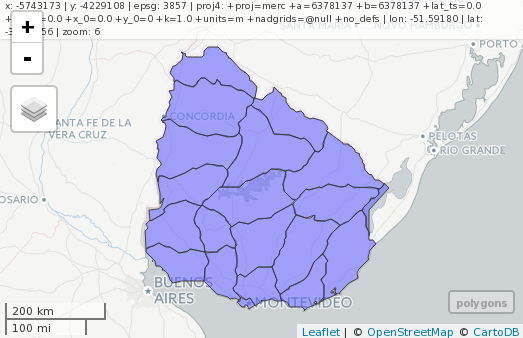
Plot example data
# Plot Polygons
mapview(polygons)

# Get polygons centroids
centroids <- as.data.frame(centroid(polygons))
colnames(centroids) <- c("lon", "lat")
centroids <- data.frame("ID" = 1:nrow(centroids), centroids)

# Create SpatialPointsDataFrame object
coordinates(centroids) <- c("lon", "lat")
proj4string(centroids) <- proj4string(polygons) # assign projection
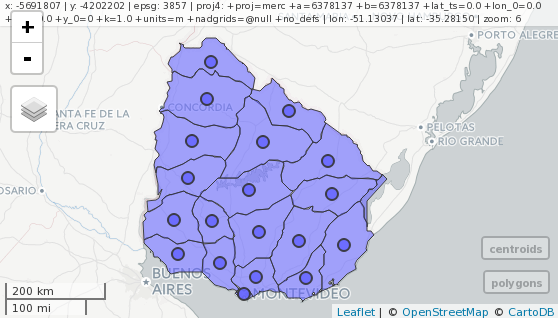
Plot polygons + centroids
# Plot Polygons + Centroids
mapview(polygons) + mapview(centroids)

Getting attributes
# Get polygons attribute for each centroid point
centroids@data <- sp::over(x = centroids, y = polygons, returnList = FALSE)

#class       : SpatialPointsDataFrame
#features    : 19
#extent      : -57.76437, -54.02354, -34.82602, -30.54739  (xmin, xmax, ymin, ymax)
#coord. ref. : +proj=longlat +datum=WGS84 +no_defs +ellps=WGS84 +towgs84=0,0,0
#variables   : 13
#names       : OBJECTID, ID_0, ISO,  NAME_0, ID_1,         NAME_1, HASC_1, CCN_1, CCA_1,       TYPE_1,  ENGTYPE_1, NL_NAME_1,  VARNAME_1
#min values  :        1,  245, URY, Uruguay,    1,        Artigas,  UY.AR,    NA,      , Departamento, Department,          ,
#max values  :       19,  245, URY, Uruguay,   19, Treinta y Tres,  UY.TT,    NA,      , Departamento, Department,          , Montevidéu
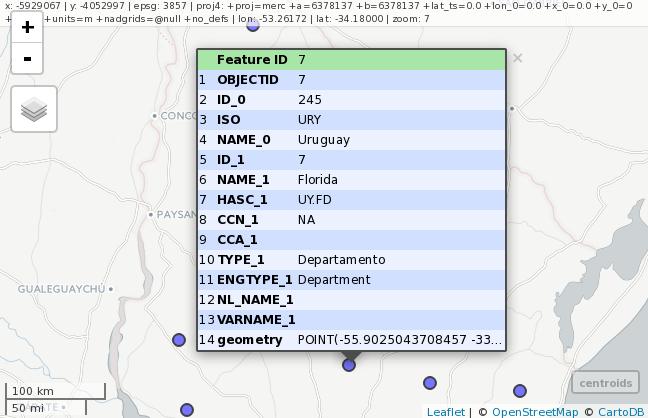
Final plot
# Plot centroids with data (click on point to see the information)
mapview(centroids)


