6

I do not even know if QGIS is the right program for what I need.

What I need: I need a program with maps (Denmark to be specific), that I could feed with a database of users through a CSV file.. e.g. give it 500 names, addresses etc. and have them dotted on the map or shown in different graphical ways, like perhaps a heat map.

What I did: tried mappoint from microsoft, quickly realised this wasn't the right program, while it was able to accept my CSV file, the way it displayed my users was of no use to me, it is a glorified 'route planner' and not suited for handling multiple selections at the same time.

Where I am at now: I downloaded and installed QGIS thinking this was it, now opening it, I have no idea what to do, and it doesn't look like it holds any standard maps so maybe this program has nothing to do with the solution I need? If not, could you direct me to one?

I'd really like to avoid uploading these CSV file and not expose my users information to the internet, which is why I found solution like google maps not to be the way to go.

4 Answers 4

7

Try the following: use the plugin mmqgis and select: -> transfer -> geometryimport from csv . select the appropriate columns for lat /long !


try the following:

goto http://www.gpsvisualizer.com/geocoder/ enter your data, e.g.

1160;Wien;Schuhmeierplatz 7;aa
1010;Wien;Opernring 1;bb

click the button "create a gpx-file"

now your browser shows somthing like this:

Your data has been converted to GPX. Right-click on the following link to download the file to your hard drive; you may want to give it a more sensible name. Click to download 1335545432-19937-80.108.48.91.gpx

download

now open this file as vector-layer via menu layer-> add vector layer- be sure you have the file-type GPS eXchange Format!

0
4

Here's an alternative.

CartoDB

You can sign up for free and upload a csv directly. CartoDB will geo-code your data. You can also use some simple SQL statements and or any custom CSS to selectively visualize particular data.

CartoDB will host your map for sharing with your users. There is paid subscription that can you choose to keep the tables private only sharing the map view and selected 'info window' data

https://cartodb.com/

Example: Some sample data I want my users to see

You can also export your data back to a CSV file with the latitude and longitudes to update your data. I like to use Fulcrum to upload my data, view it on a map, and download it to my GPS enable smartphone for asset management & data collection updates. Includes photos too.

0
2

There are two answers depending on what type of data you have.

  • If you have lat/long or coordinates, you can import the CSV file to QGIS and create your map via 'Add Delimited Text Layer'. There are some limitations to the CSV parser, so your CSV needs to be formatted just right. Here are detailed instructions that may help.

  • If you do not have coordinates, then the task becomes 'geocoding' - converting addresses into coordinates. There are many ways to do that. Here is a good guide.

0
-1

you raised an very interesting question: How to keep privacy of data while using simple CSV file as an input. Very simple task at its core and yet, not so easy to find a solution.

Well, there are three components listed above that needs to be resolved at once.

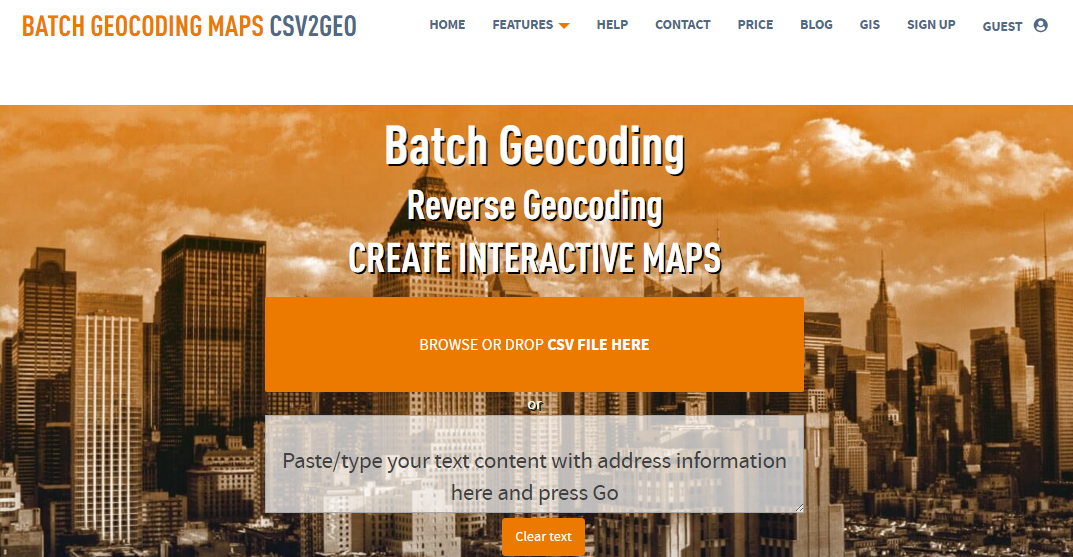
There is a tool that incorporate all three. Check Batch Geocoding tool called CSV2GEO. It comes with a free level, monthly subscription and an API. It takes CSV UTF8 formatted files as an input, copy/paste text or machine API request.

Let's create a sample CSV file with the top 5 cities in Denmark by population.

Copenhagen, Denmark
Aarhus,Denmark
Odense,Denmark
Aalborg,Denmark
Frederiksberg,Denmark

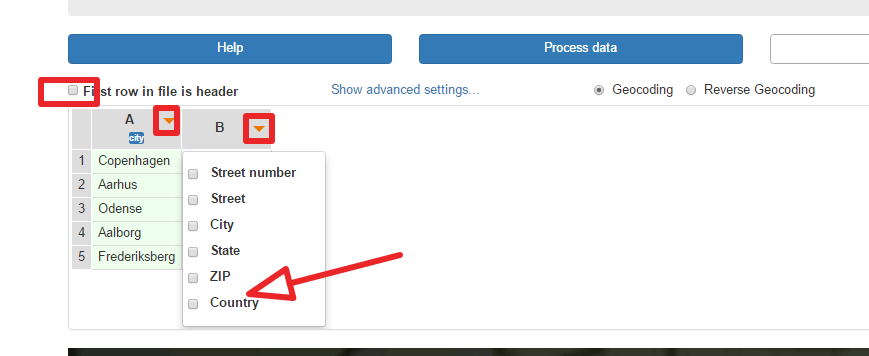
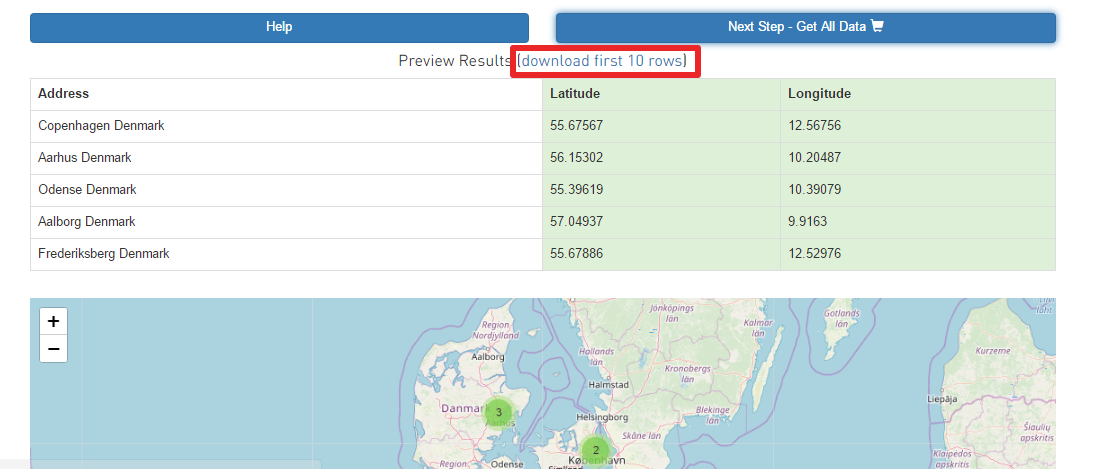
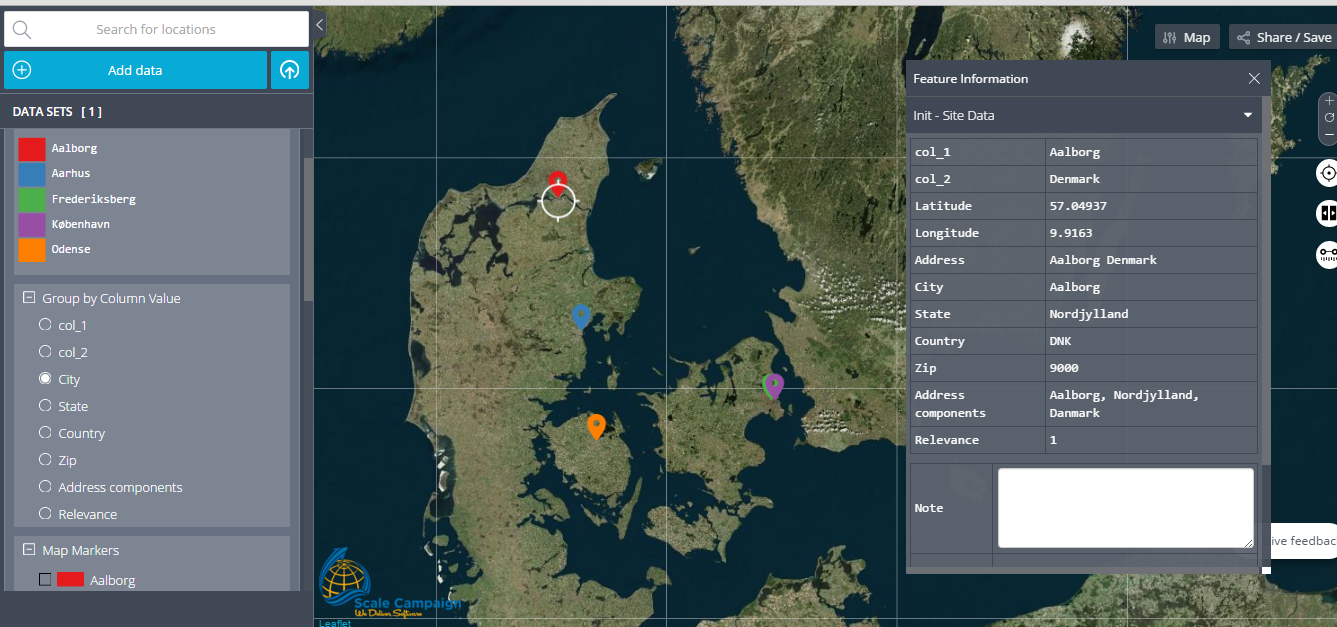
Load the file in CSV2GEO enter image description here Then select if first row is header or not. If headers exist, the system will auto recognize them. User can also manually select each column header to be part of address tokens. enter image description here Click Process Data. If user is not signed up or logged in, the system will ask for that. Then it will show the first ten calculated rows(in our example 5) and provide sample file with the final results for download. enter image description here If everything checks up, click Get all Data. At this point the system will move the user to Work History where converting address to lat long as step one is done. enter image description here To get the map, simply click on Map it button. That is the second component of the puzzle. That simple click open an interactive map that automatically places the data from the csv file there. enter image description here The site offers demo for interactive map as well. The map comes with all kind of features: from the trivial heat map, filtering, custom icons, to more interesting one with WMS server layers, double circles, four ways of sharing data, etc..For full number of features check Interactive Map features. And finally, addressing the third component : privacy. CSV2GEO is build from ground up to support GDPR and HIPPA. Its Batch Geocoding Security will help you maintain safe and easy data migration.

In summary, the tool does provide an easy solution for creating maps from CSV and distributing them among other users.

2

Not the answer you're looking for? Browse other questions tagged or ask your own question.