My goal to draw vector lines on top of a map that have directional 'arrowheads' along the direction of the line. The 'arrowhead' is really a style using a 'regular shape' of a triangle.
I want the map produced to have a larger size so that it approximates a resolution of 300 dpi (instead of the screen standard 96 dpi) so I can download that image and embed it in other applications where it will look like 300 dpi.
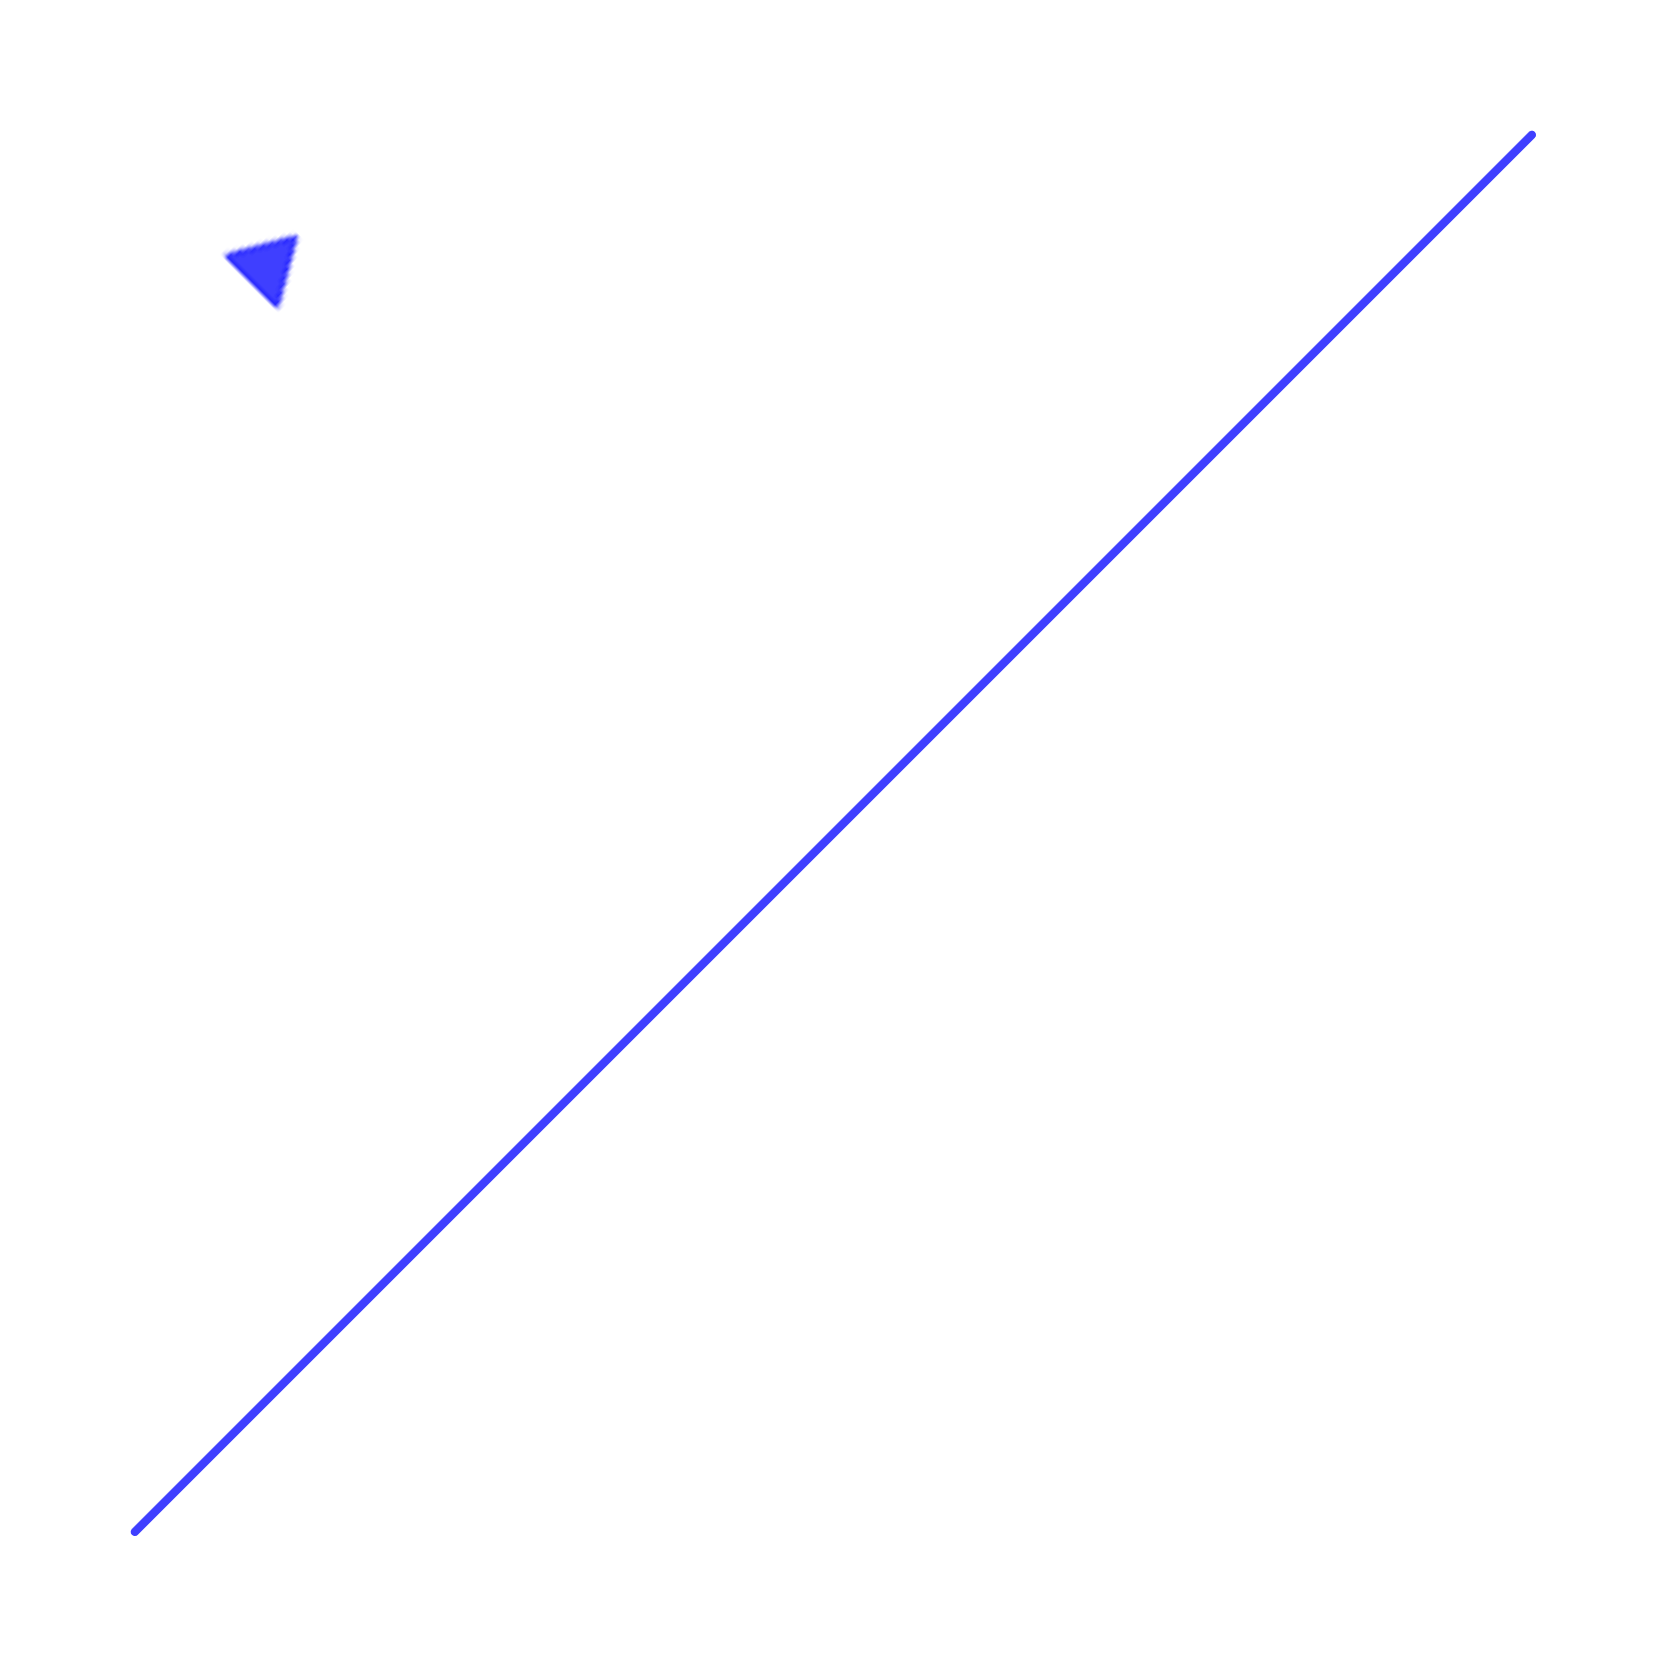
My code works for scaling up the original line but as for the 'arrowhead' triangle I can get it to increase it's size but it's no longer positioned at the center of my line segment, it stays at the center location of the line before it was scaled up.
Here's an example using a single line with an arrow, nothing else on the map.
First the html:
<!-- <!DOCTYPE html> -->
<html>
<head>
<script src="https://code.jquery.com/jquery-1.11.2.min.js"></script>

<link rel="stylesheet" href="https://maxcdn.bootstrapcdn.com/bootstrap/3.3.4/css/bootstrap.min.css">
<script src="https://maxcdn.bootstrapcdn.com/bootstrap/3.3.4/js/bootstrap.min.js"></script>

<link rel="stylesheet" href="https://cdnjs.cloudflare.com/ajax/libs/openlayers/4.2.0/ol.css" type="text/css">
<script src="https://cdnjs.cloudflare.com/ajax/libs/openlayers/4.2.0/ol.js"></script>

</head>
<body>
    <div id="mapdiv">
        <div id="map" class="map" style="width: 400px; float: left; height: 400px;"></div>
    </div>
    <script type="text/javascript" src="js/map_canvas6.js"></script>
</body>
</html>
And the javascript:
var saveDPI = 300; // dpi of saved image
var zoomLevel = 17; // map zoom level
var pathColorRGBA = [ 0, 0, 255, 0.75 ]; // line color and opacity
var tangentSegmentLengthPct = 10; // percent of the length of the line used to
                                // calculate the tangent
var pathWidth = 2.0;  // line width

//function to change the map canvas scaling to get desired size for saved image
function setDPI(canvas, dpi) {
    var scaleFactor = dpi / 96;
    canvas.width = Math.ceil(canvas.width * scaleFactor);
    canvas.height = Math.ceil(canvas.height * scaleFactor);
    var ctx = canvas.getContext("2d");
    ctx.scale(scaleFactor, scaleFactor);
}

// function to calculate tangent to line to set arrow direction
function tangentToLine(geometry) {
    var ptLoc = 0.5;
    var ptDelta = 0.1;
    var coordCenter = geometry.getCoordinateAt(ptLoc);
    var coordBefore = geometry.getCoordinateAt(ptLoc - ptDelta / 100);
    var coordAfter = geometry.getCoordinateAt(ptLoc + ptDelta / 100);
    var dx = coordAfter[0] - coordBefore[0];
    var dy = coordAfter[1] - coordBefore[1];
    var rotation = Math.atan2(dy, dx);
    return rotation;
};

// function to create 'arrowhead' style to draw along line segment
function createArrowStyle(coordPt, radius, rotation, fillColor, strokeColor) {
    return new ol.style.Style({
        geometry : new ol.geom.Point(coordPt),
        image : new ol.style.RegularShape({
            fill : new ol.style.Fill({
                color : fillColor
            }),
            points : 3,  // triangle 'arrowhead'
            radius : radius,
            stroke : new ol.style.Stroke({
                color : strokeColor
            }),
            rotateWithView : false,
            rotation : -rotation + (Math.PI / 2)
        })
    });
}

// style of base line
var lineStyle = function lineStyle(width, color) {
    return new ol.style.Style({
        stroke : new ol.style.Stroke({
            color : color,
            width : width
        })
    });
};

// style function for the line segment feature
var styleFunction = function(feature, resolution) {
    var geom = feature.getGeometry();
    var styles = [ lineStyle(pathWidth, pathColorRGBA) ];
    var rotation = tangentToLine(geom);
    var radius = 10; // size of arrowhead
    var centerCoord = geom.getCoordinateAt(0.5);
    var arrowStyle = createArrowStyle(centerCoord, radius, rotation,
            pathColorRGBA, pathColorRGBA);
    // Here's where the arrowhead size is scaled up
    arrowStyle.getImage().setScale(saveDPI/96);
    styles.push(arrowStyle);
    return styles;
}

// map projection, a flat x-y plain
var proj = new ol.proj.Projection({
    code : 'EPSG: 404000',
    units : 'm'
});

// map viewport
var view = new ol.View({
    projection : proj,
    center : [ 400, 400 ],
    zoom : zoomLevel,
});

// map feature source
var source = new ol.source.Vector();

// make a simple straight line feature and add it to the source
var coordinates = [ [ 200, 200 ], [ 600, 600 ] ];
var line = new ol.geom.LineString(coordinates);

var feature = new ol.Feature({
    geometry : line,
});

source.addFeature(feature);

// make layer and add source and style function
var layer = new ol.layer.Vector({
    style : styleFunction,
    source : source
})

// create simple map
var map = new ol.Map({
    target : 'map',
    logo : false,
    layers : [ layer ],
    controls : [],
    interactions : ol.interaction.defaults({
        dragPan : false,
        mouseWheelZoom : false,
        doubleClickZoom : false
    }),
    view : view
});

// get map canvas
var canvas = $('canvas').get(0);

// increase the size of the map canvas so that when exported it looks like        300 dpi
map.on('precompose', function(event) {
    setDPI(canvas, saveDPI);
});

// draw map
map.renderSync();
The output looks like this (The arrowhead should be in the middle of the line) :
I made a fiddle of the above it's at https://jsfiddle.net/rickblaine/z4y096so/
I expect there's some property of the style that will recenter the arrow in the center of the line but I haven't found it.

