I am attempting to calculate slope from a temperature/elevation relationship on a particular grid I have defined in ArcMap, however I am unsure how to effectively approach it. The first image attached is from monthly PRISM temperature data, the second is the corresponding 800 m elevation DEM grid that lies under it. My expectation is to take the maximum and minimum value in each cluster of grids and get a slope (degree Fahrenheit change/foot).
-
1Since you are wanting a slope between two variables, you are effectively talking a regression slope and not a rise/run. It is possible to derive a regression slope raster using the raster calculator.– Jeffrey EvansCommented Jul 14, 2017 at 17:58
-
@JeffreyEvans, thanks for getting back to me! That's exactly what I am trying to achieve over a smaller region. How would I go about structuring this in Raster Calculator using the two raster layers given?– E. WeglarzCommented Jul 14, 2017 at 18:40
1 Answer
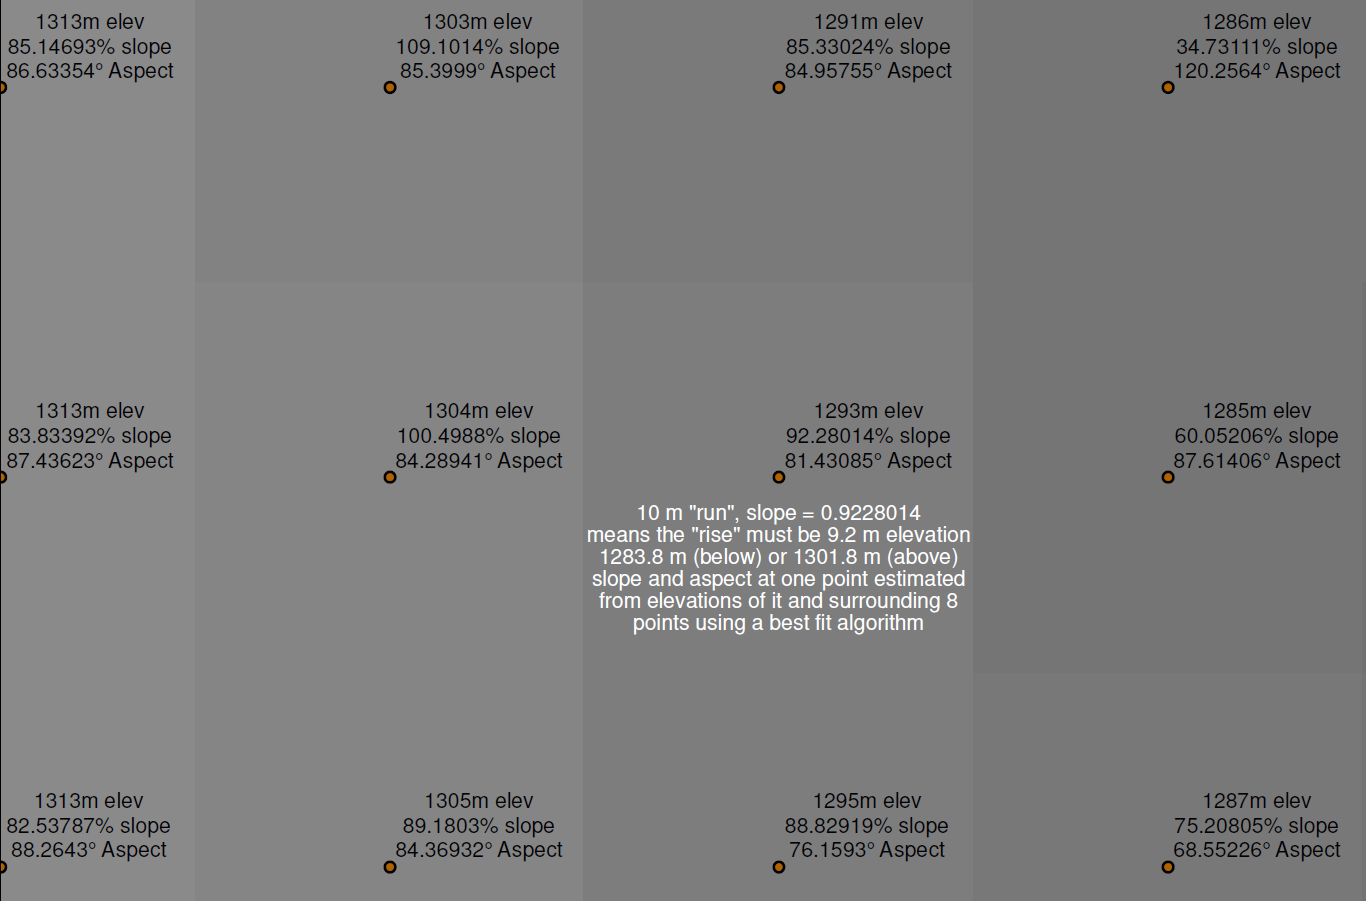
Agred with the above comment... "slope" is calculated as below.. and is likely not done how you would think.
It sounds like you need to incorporate some neighborhood statistics to get to your endpoint, but this could be done by creating additional rasters using Spatial Analyst Tools>Neighborhood>Block Statistics and picking the applicable statistics.
I would then convert one raster to point (Conversion Tools>From Raster>Raster to Point), then use Spatial Analyst>Extraction>Extract Multi Values to Points to get the value from the other rasters into the same point, then manipulate the table in Excel or something and import the result as points and convert back to raster.


